
- Summer 2024: PROPERTY
Property loss adjusting
Report objectives
This report aims to summarize the present metrics for our U.S. property programs, assess the current landscape of the property claims market, and benchmark our patterns against comparable industry research.
Unlike workers’ compensation, motor liability or general liability, property is not a monolithic product line. U.S. property consists of property loss adjusting and specialty services. Property loss adjusting contains five distinct product lines: catastrophe (CAT), high frequency low severity (HFLS), middle market, large loss and third-party administrator. Each of these has its distinct market, clients, competitors, pricing and service requirements. The specialty services division encompasses our forensic advisors/accountants, EFI Global (forensic engineering, environmental and fire experts), contents evaluators and building consultants. Sedgwick repair solutions, our direct repair network and temporary housing are also significant and growing segments of U.S. property.
data parameters
Our practice team uses claims data to perform comparative analyses informed by their expertise and analytics. This report is based on data for U.S. claims only in order, though it is important to note Canada and Latin America are also significant pieces of our property, Americas business.
Key observations
The first half of 2024 saw a stabilization of the Sedgwick U.S. property business. The first half of 2023 was impacted by continued Hurricane Ian revenue from 2022 and winter storm activity from Q1 2023. Incoming core assignments stabilized in the second half of 2023 due to minimal storm activity.
The market-wide softening of volume impacted all property lines, but Sedgwick has been able to partially offset this with new product offerings and client expansions to other lines.
Challenges around talent continue to persist, such as recruitment and labor shortages, particularly when seeking experienced commercial or desk adjusters.
Pressure to meet defined metrics continues to be an industry focus.
We continue to drive complementary service referrals both internally and externally across the market. This provides our internal and external customers with the benefit of being able to engage our wealth of claims services quickly and seamlessly.
Digital automation and artificial intelligence (AI) kicked off our reformed digital transformation strategy within property in early 2023. It is a two-pronged approach slated to begin delivering enhancements in Q3 2024:
| • | Enhance our claims experience and platforms to continue to position ourselves as an industry leader. |
| • | Focus on digitally transformative projects that can immediately enhance process efficiencies and the end-user experience. |

New claim count by line of business
Overall, new claim assignments are down 17.5% and we are on an upward trajectory despite continued slow conditions and are reacting effectively to offset market conditions.
Efforts to generate business and offer our full suite of services drove new claims up in H1 2024. New claim assignments are up 3% in H1 2024 compared to H2 2023. This is driven both by increased efforts and success in securing non-weather-related business and some small weather events during H1 2024.

One key driver of overall performance is the instability of HFLS market trends. HFLS is highly focused on high volume and low severity claims that typically align with storm activity.
Pending vs. new claims (excluding repair solutions)
Pending assignments are down 7.5%. This key indicator is monitored closely to ensure our claims are cycling to meet customer expectations. Assignment closure drives the first payment to policyholders, which is a primary driver of carrier net promoter scores. This first payment and overall quick closures are particularly important in the HFLS space.
In alignment with the new claim data, our pending claims are also trending upward. This is a direct result of efforts and success in securing organic non-weather-related growth as well as some weather-related growth due to storm activity over the first two quarters.
New claims: Field operations vs. HFLS
We continue to be a full-service claims provider by diversifying our portfolio of service offerings while focusing on all lines, including personal lines, mid-market and large loss. Within the personal lines space, the HFLS business unit continues to be an area of growth. The industry’s approach and expectations for adjusting and handling these claims are different.
We continue to build and develop market-leading solutions to capture market share by utilizing technology to increase speed, efficiency and overall cycle time. These include inside-outside models, outsourced desk units and our new-to-market motor adjudication tool. This motor adjudication tool allows a policyholder to interact with a digital tool on smaller losses, capturing all relevant claim data. When completed, we can quickly utilize that data to provide an initial settlement/payment recommendation back to the carrier/client. This tool has shown the ability to reduce the standard on-site claims process average down to the same day as reported.
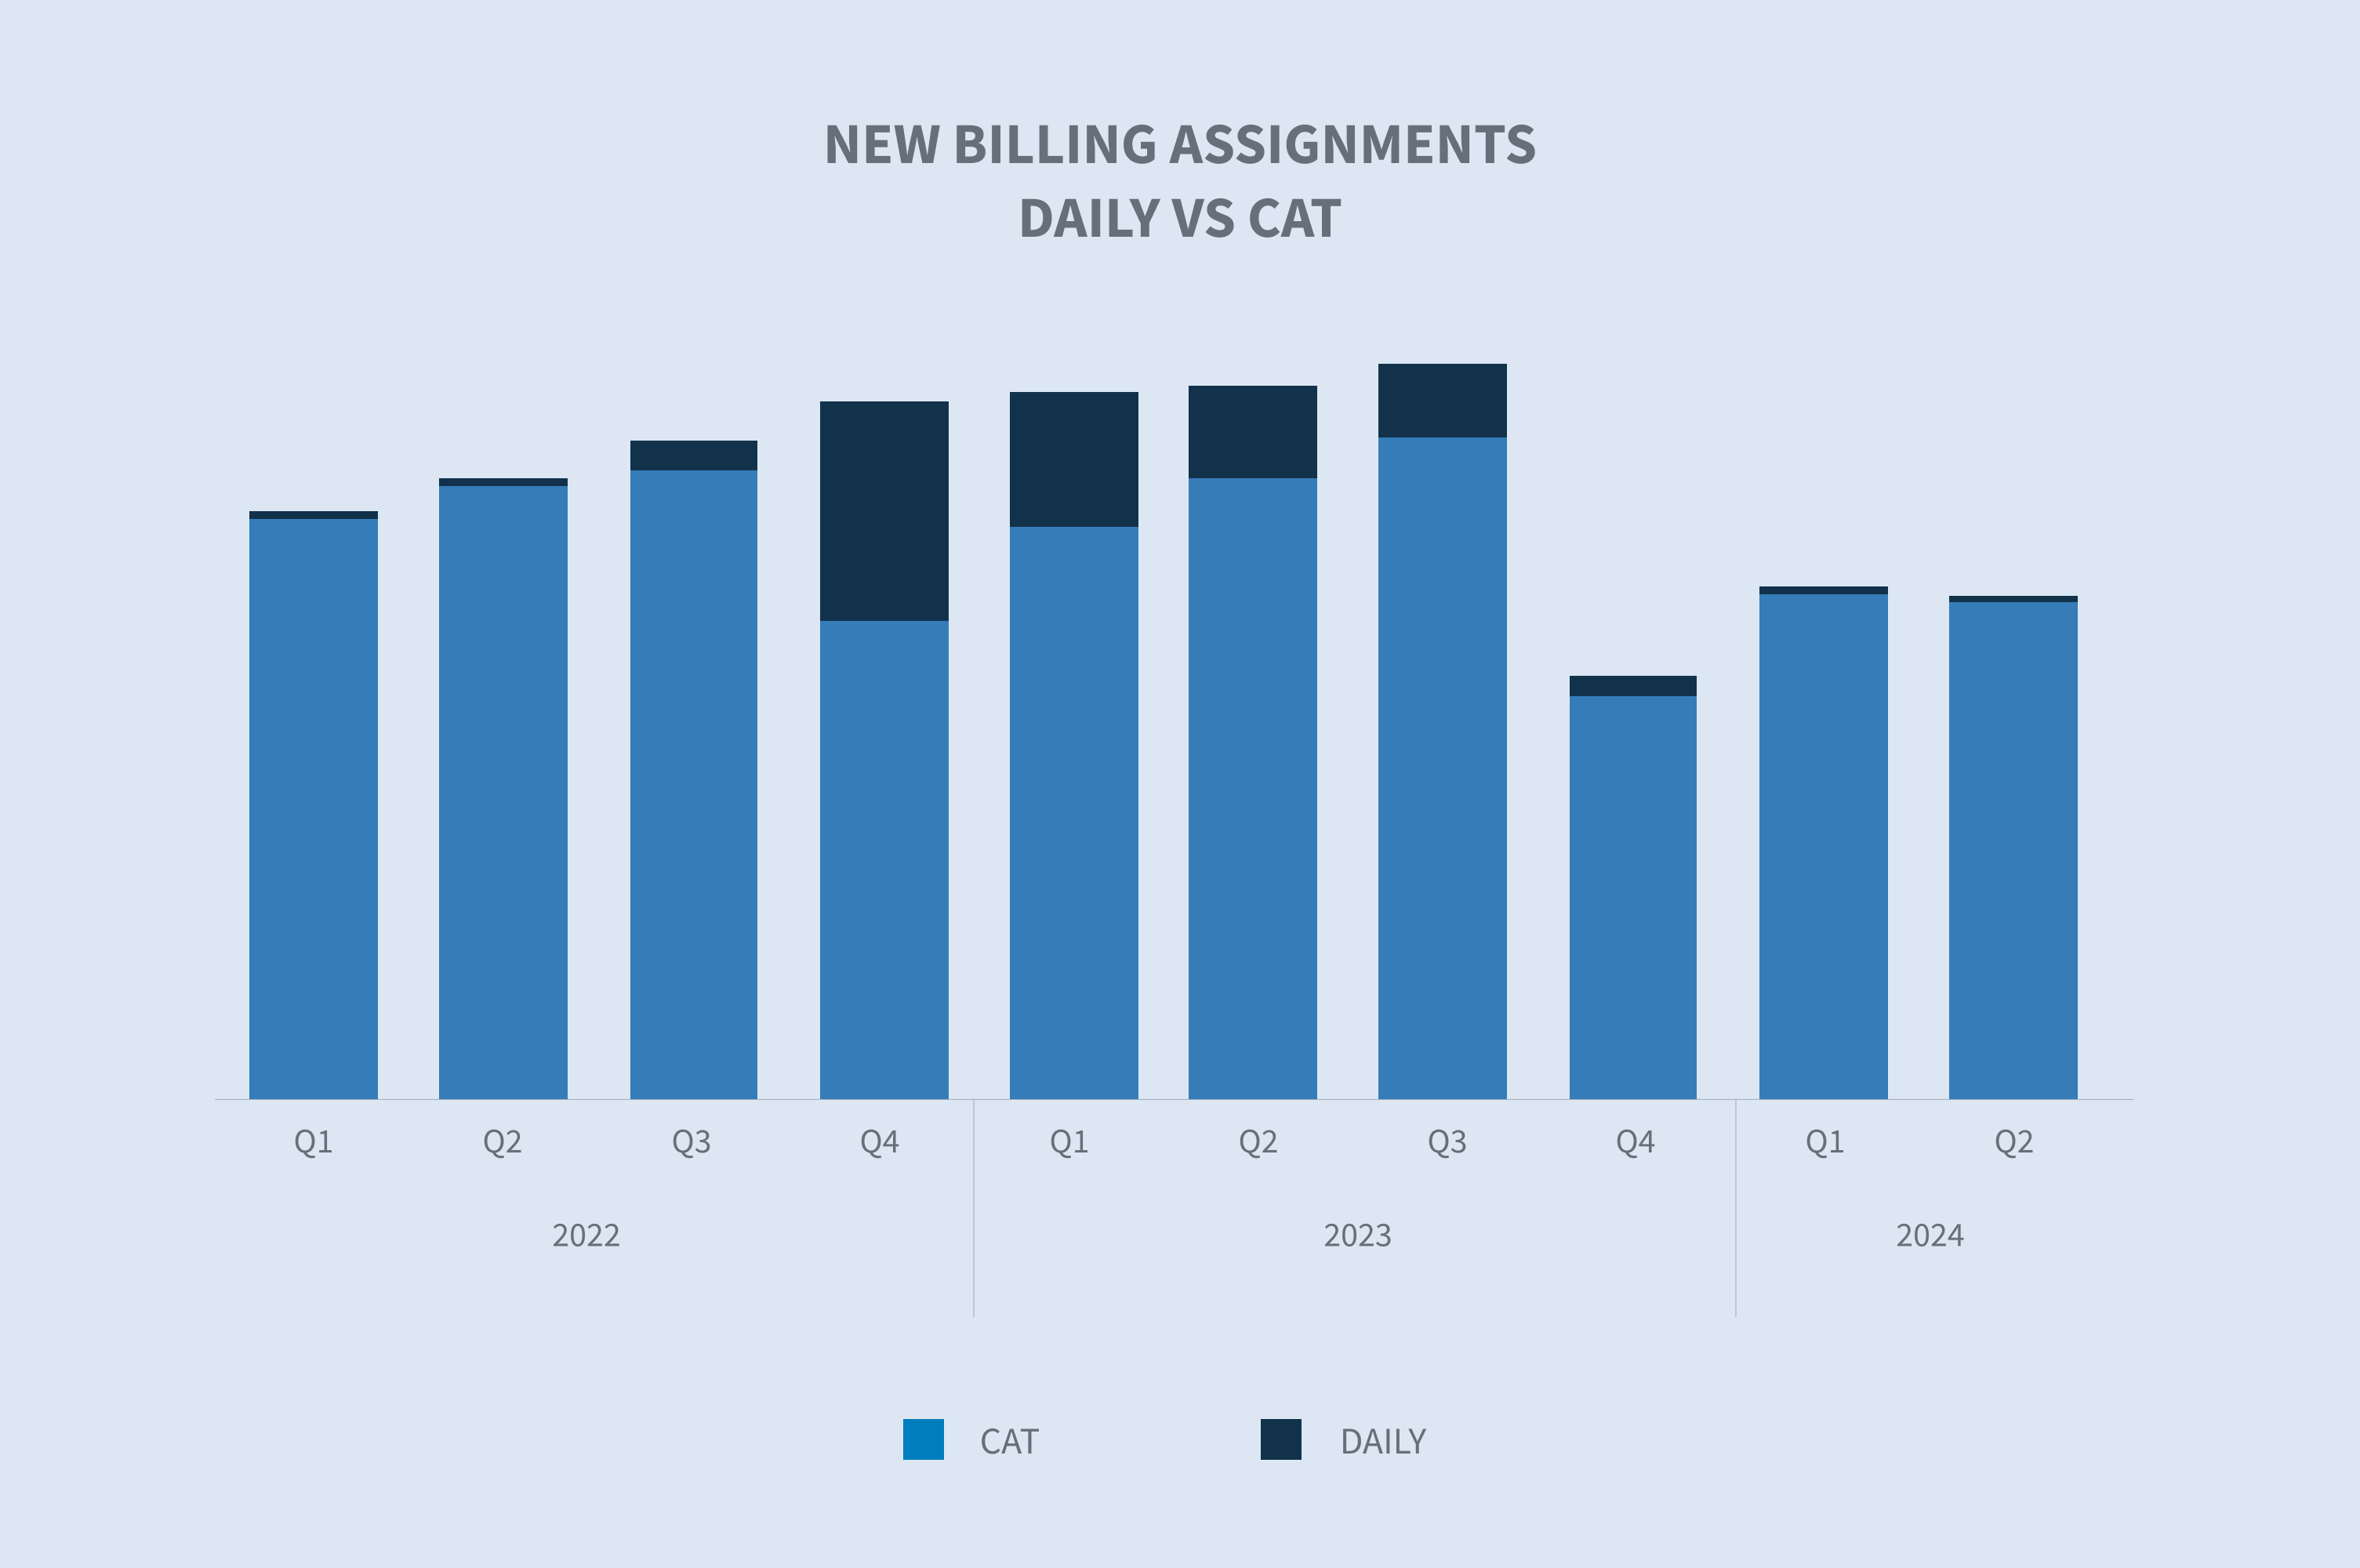
Our new billing assignment data aligns with these overall trends as well as the seasonality and volatility that weather can drive in the HFLS space.

New claims vs. CATs
All data points toward a potentially historic 2024 Atlantic hurricane season. Yet, year-to-date storm losses remain below the annual average. The average annual cost for billion-dollar disasters over the last five years (2019-2023) is $123.4 billion. As of Aug. 8, 2024, the YTD cost in the U.S. totals $49.6 billion. The volume over H1 2024 is consistent with prior years, but the total damages lag. The graph below shows prior major years, noting that 2023 is not included.

(Data source: NOAA National Centers for Environmental Information “Billon-Dollar Weather and Climate Disasters”)
The last major CAT event took place in Q4 2022 (Hurricane Ian), with volume continuing from that event into early 2023. When comparing new CAT assignment volume to daily core volume, we see a downturn in CAT assignments beginning in Q3 2023 and continuing through Q2 2024.
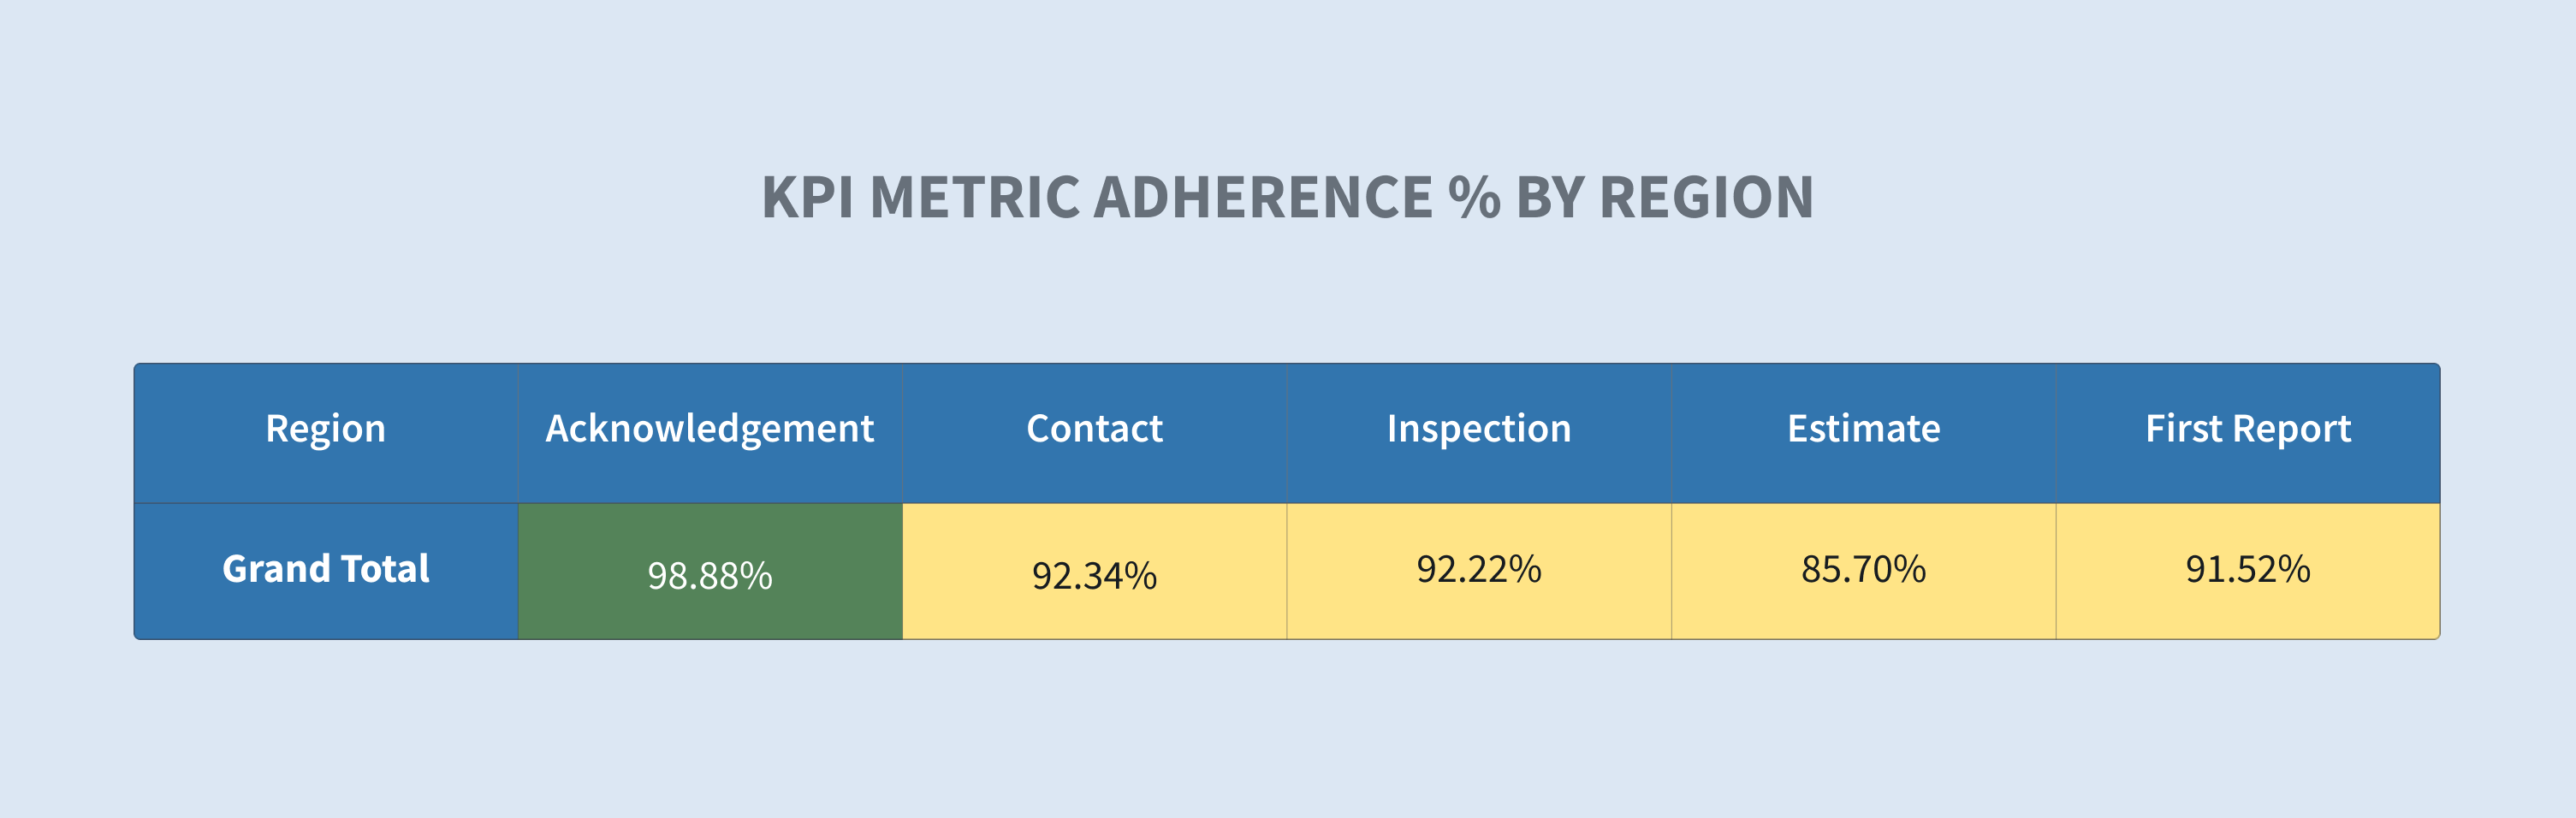
Key metrics
Metric performance continues to be a key determining factor in our clients’ choice of vendor partner. We continue to increase resources and tools to improve our ability to calibrate, capture and present metrics. This data allows us to drive increased performance through management by exception. In 2023, we are increasing spending on automation to enhance communication with policyholders, claimants, and clients. We are leveraging robotic processes and AI to expedite claims and improve efficiency. While some tools, like robotic claims processes, are already in place, the major AI-driven tools from this investment are expected to be operational in Q3 and Q4 of 2024.
Below is an example of data provided to our field managers to drive metric compliance. It shows a subset of our field claim inventory at the roll-up level. Our leaders, managers, supervisors and adjusters can use this data to drill down to the client, region, office and adjuster levels to view specific performance and drive improvement for our clients.
Future considerations
The U.S. property business saw a stabilization of incoming claim volume with a slight growth in comparison to H2 2023. This is due to the addition of new organic business growth and some minor CAT events driven by spring/summer convective storm activity. We see this upward trend continuing as we focus on CAT capabilities and look toward what is predicted to be an extremely active 2024 Atlantic hurricane season. At the same time, we will focus on driving new business through increased business development activities across all segments, including the HFLS, middle market and large loss spaces.
Diversification of our service offering portfolio in the U.S. property business continues to be a key strategy. This allows us to turn a single assignment into multiple opportunities and provide our clients with a seamless approach to get the results they need by leveraging the interconnectivity and speed with which we can deliver those services.
Utilization of technology and how to best employ it to drive efficiency and results across all of Sedgwick is key to long-term sustained growth and profitability. From new and exciting claims handling solutions like motor adjudication to leveraging robotic processes and AI to increase the efficiency of processes, we remain committed to being a market leader in enabling technology to advance the business. Using technology as a tool to drive performance with various exception-based management tools remains a constant focus so we can have the visibility to quickly address challenges and trends. Our focus on continuous advancement driven by data to improve our customer experience is a key priority.
Industry concerns
Metric performance continues to be a key determining factor in our clients’ choice of vendor or partner. We continue to increase our resources and tools to improve our ability to calibrate, capture and present metrics. This data allows us to drive increased performance, via management by exception.
| • | Climate change impact on surge claim events |
| • | Emerging technologies (automation/AI) |
| • | Metrics |
| • | Wage pressure |
| • | Labor competition (expertise market) |
| • | Experienced labor (catastrophe) |
| • | Graduating talent |
