
- Summer 2024: CASUALTY
Workers’ compensation
Report objectives
This report aims to summarize the present metrics for our workers’ compensation (WC) programs, assess the landscape of WC claims and litigation, and benchmark our patterns against comparable industry research. To aid our analysis, we utilized research from the following entities:
| • | National Council on Compensation Insurers (NCCI) |
| • | California Workers’ Compensation Insurance Rating Bureau (WCIRB) |
| • | Workers’ Compensation Research Institute (WCRI) |
data parameters
Our practice team uses JURIS claims data to perform comparative analyses informed by their expertise and analytics. The data in this report is based on both insured and self-insured claims for all states across five, 12-month periods (referred to as FY) from July 1, 2020, through June 30, 2024. Information regarding COVID-19 claims continues to be reported separately to allow analysis of the impact on Sedgwick’s WC claims line.
Key observations
WC claim volume decreased 0.6% from 2023 to 2024. Excluding COVID-19 claims — for which the public health emergency declaration in the U.S. ended May 11, 2023 — the volume increased 1.8% from 2023 to 2024.
The number of COVID-19 claims received over the past 12 months declined by approximately 78% compared to FY 2023. The healthcare industry continued to have the largest share of COVID-19 claims during this period.

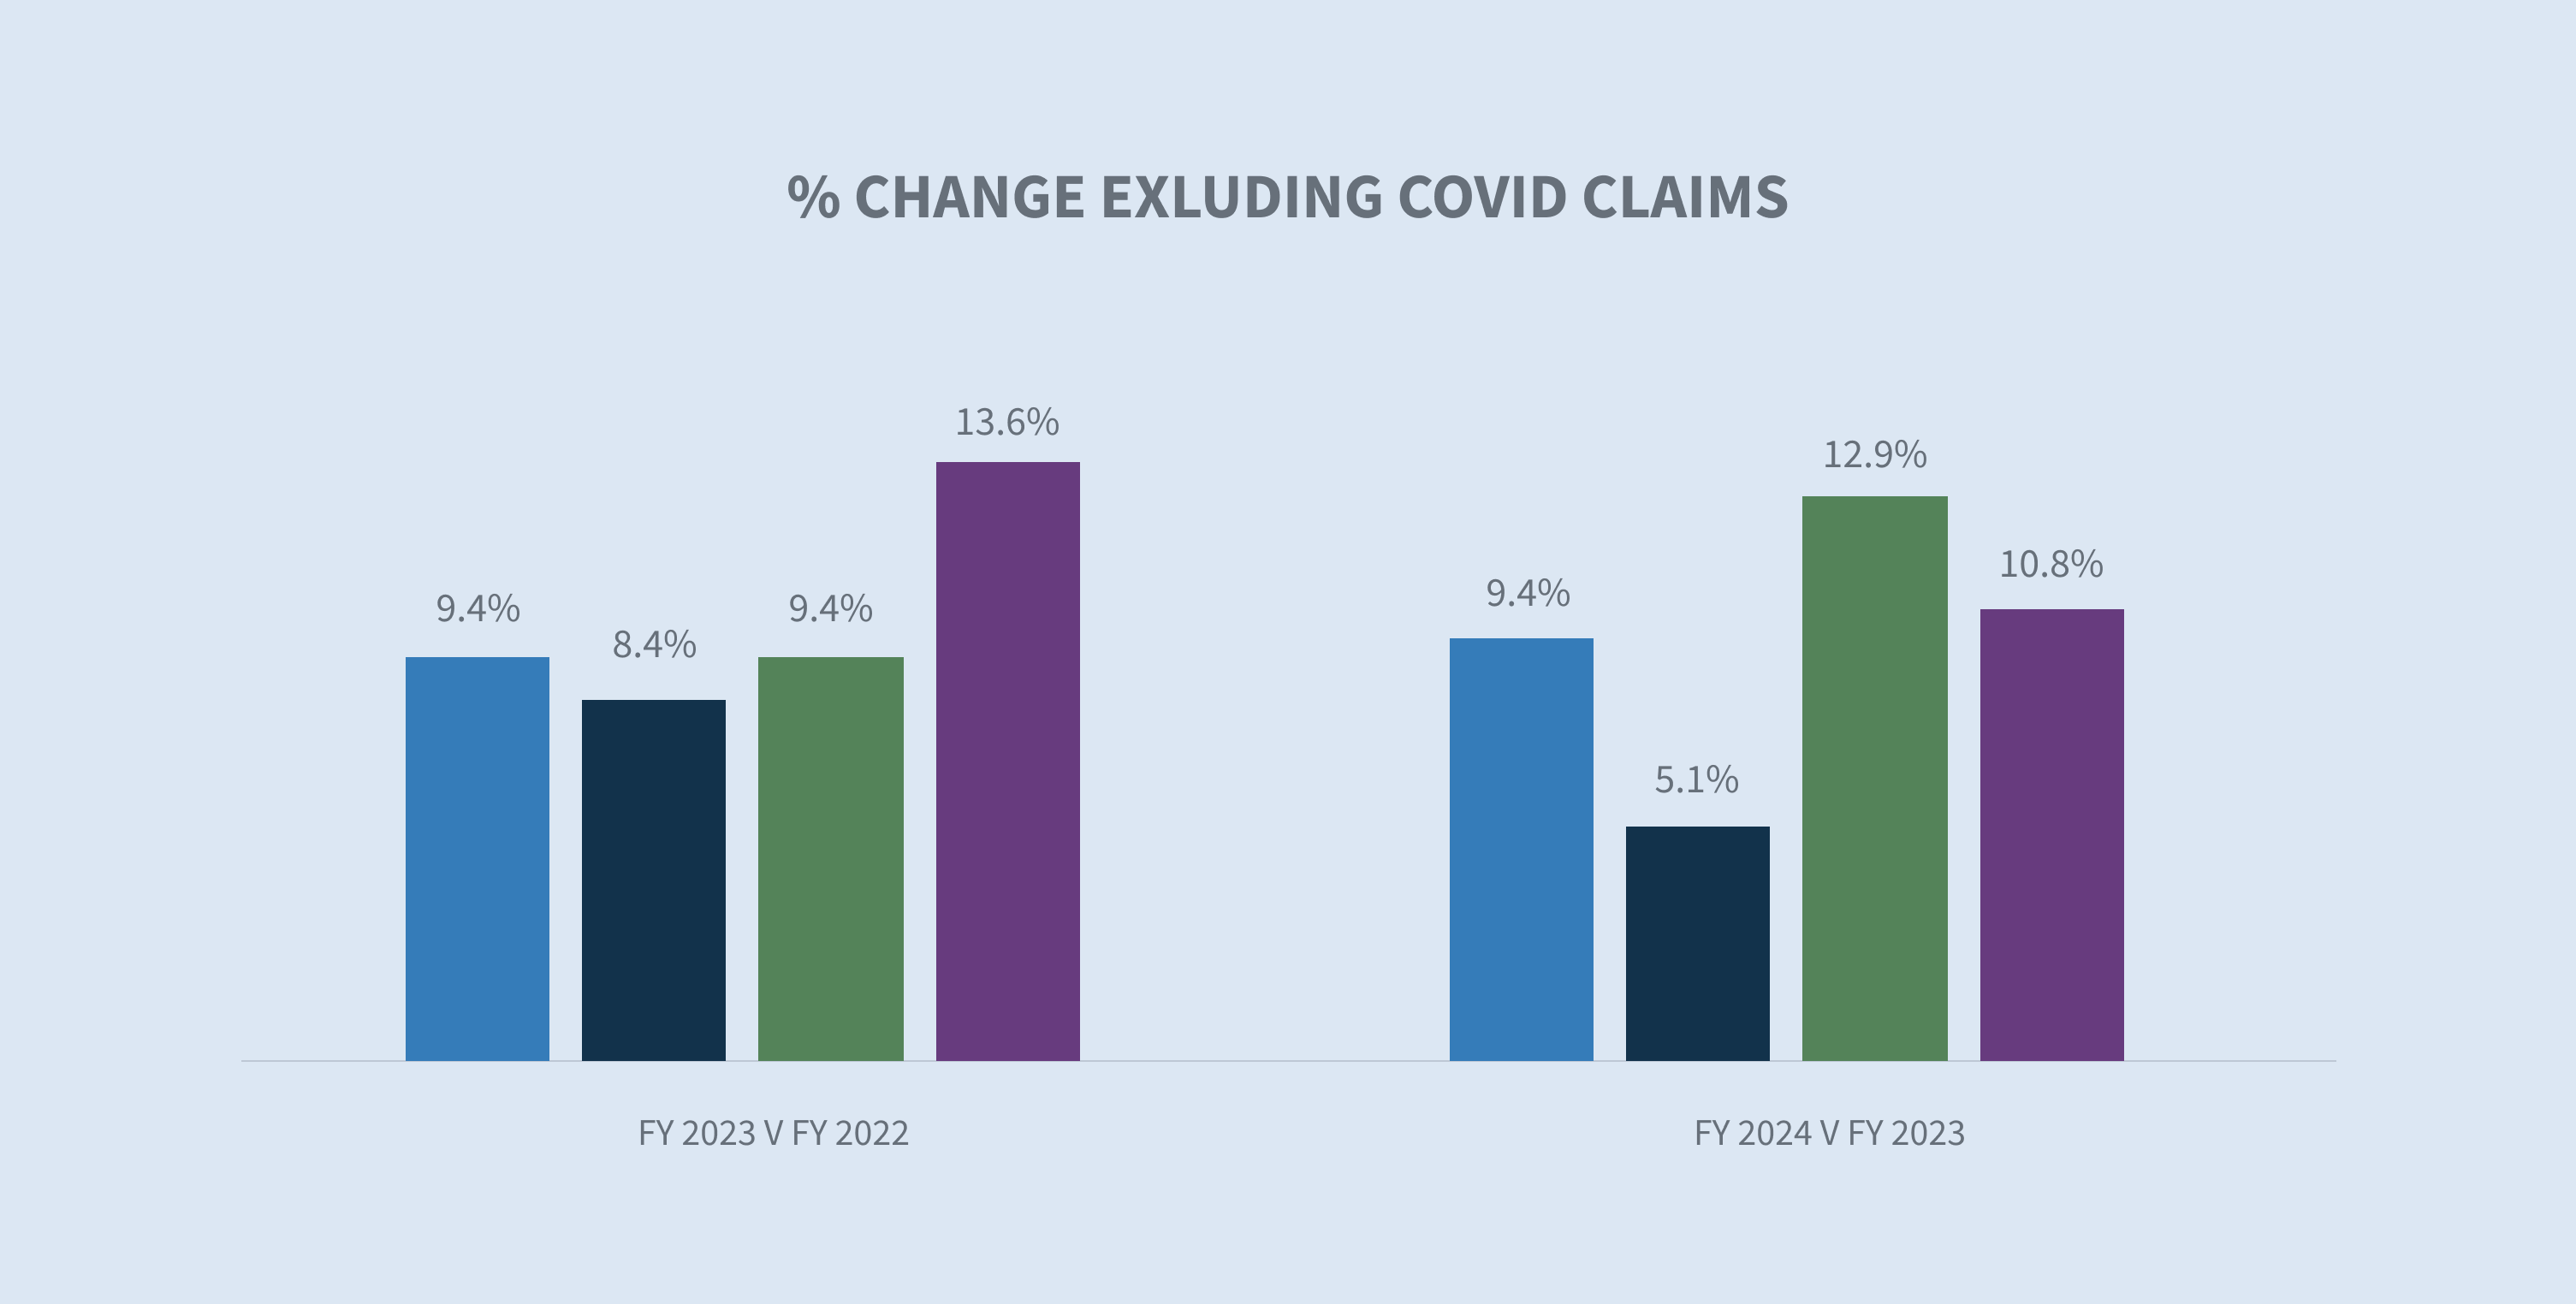
The average paid per indemnity claim increased 10.2% in 2024, with increases in every paid category. Excluding COVID-19 claims, the increase in the average paid per indemnity claim was 9.4%, demonstrating the continued impact of COVID-19 on WC results.
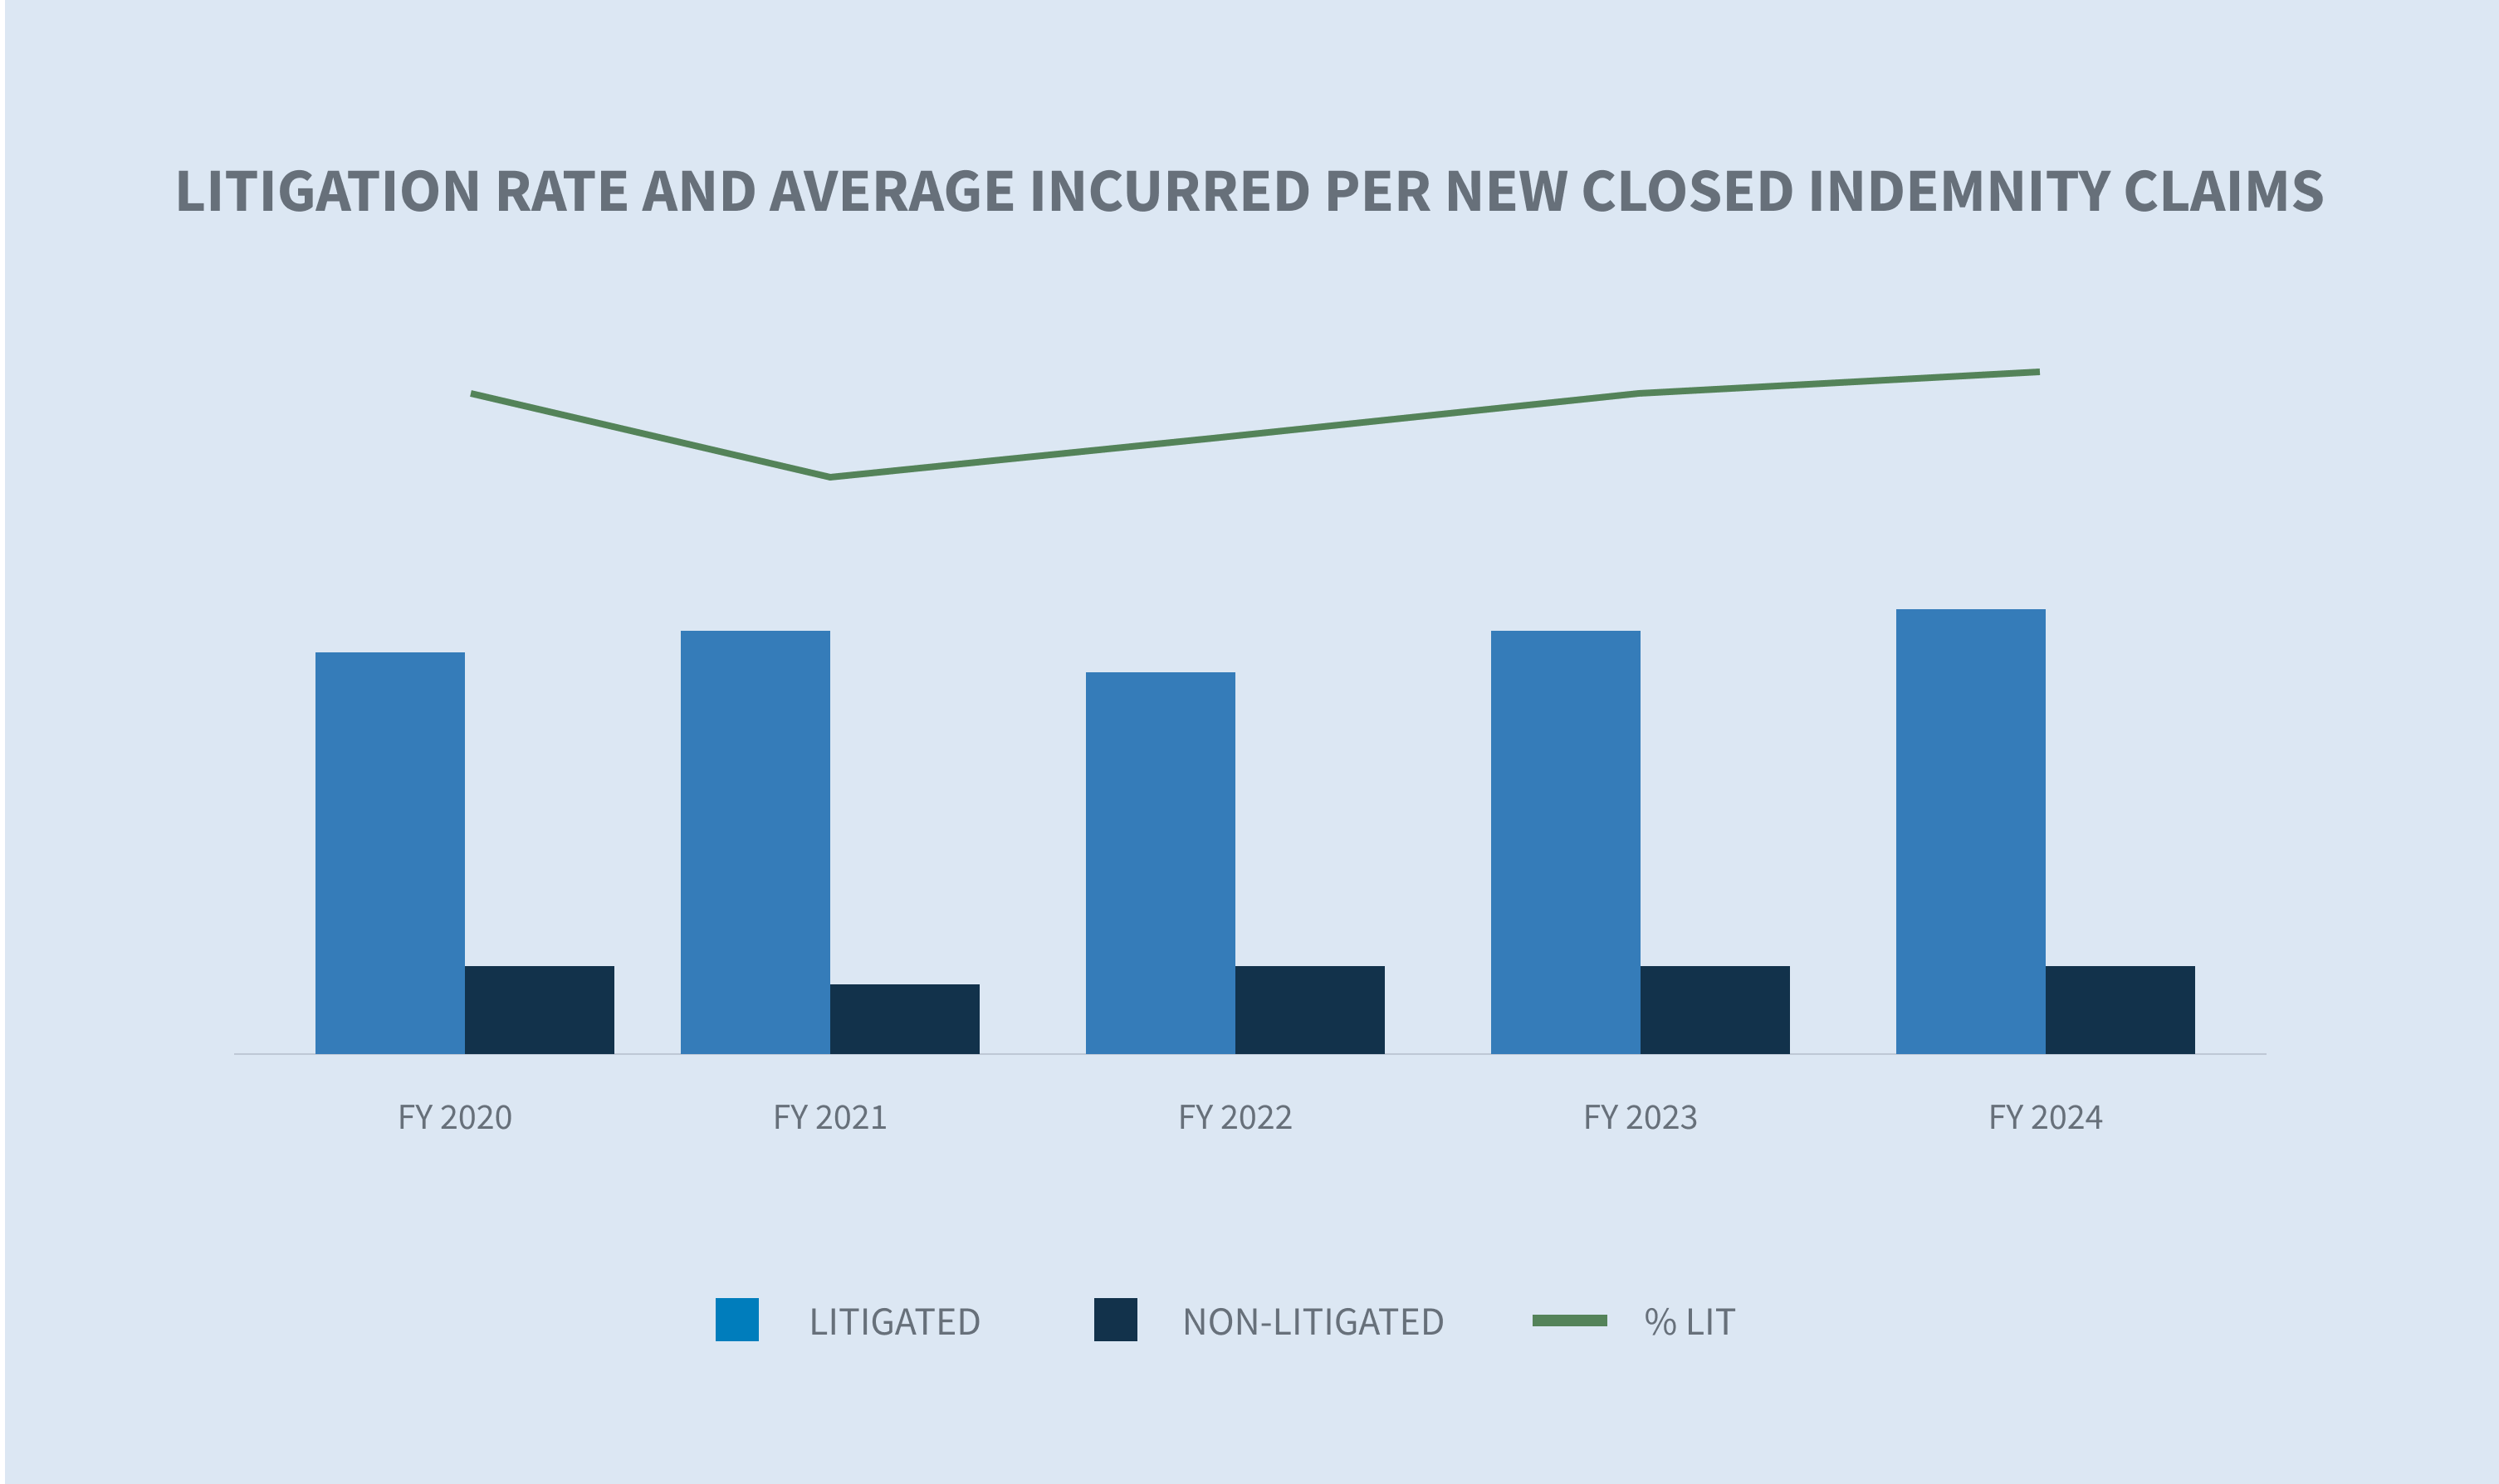
The litigation rate for indemnity claims increased from 11.9% to 12.6%. Average incurred per litigated indemnity claim increased 5.3% and non-litigated indemnity claims increased 9.7%.
The overall WC claim closure and duration rates in 2024 were consistent with 2023 results.
Market
According to the NCCI “State of the Line” report released on May 14, 2024, during their Annual Insights Symposium, WC remains the most profitable segment of the commercial property and casualty insurance (P&C) line. Key insights from this report, compiled from insurer results for the 38 states in which NCCI recommends WC rates, include:
| • | WC continues to have the largest underwriting profitability of all the P&C lines shown, with a calendar year net combined ratio of 86% and a 23-point operating gain in 2023 — a 14% underwriting gain combined with a 9% investment gain. |
| • | Severity changes were considered moderate for 2023, with increases of 2% for medical claim severity and 5% for indemnity claim severity. |
| • | The WC 2023 accident year combined ratio is 98%, with prior years continuing to experience downward reserve development. |
Despite its strengths, the data presents several issues that the WC market must navigate, such as:
| • | Lost-time claim frequency declined by 8% in the past year, which is more than two times the size of the long-term average decline. |
| • | Workers’ share of total P&C industry net premium has decreased from nearly 8% to 5% from 2003 to 2023. |
| • | Net written premium for the WC insurance market grew by just 1% from 2022 to 2023, from $42.5 billion in 2022 to $43 billion in 2023. |
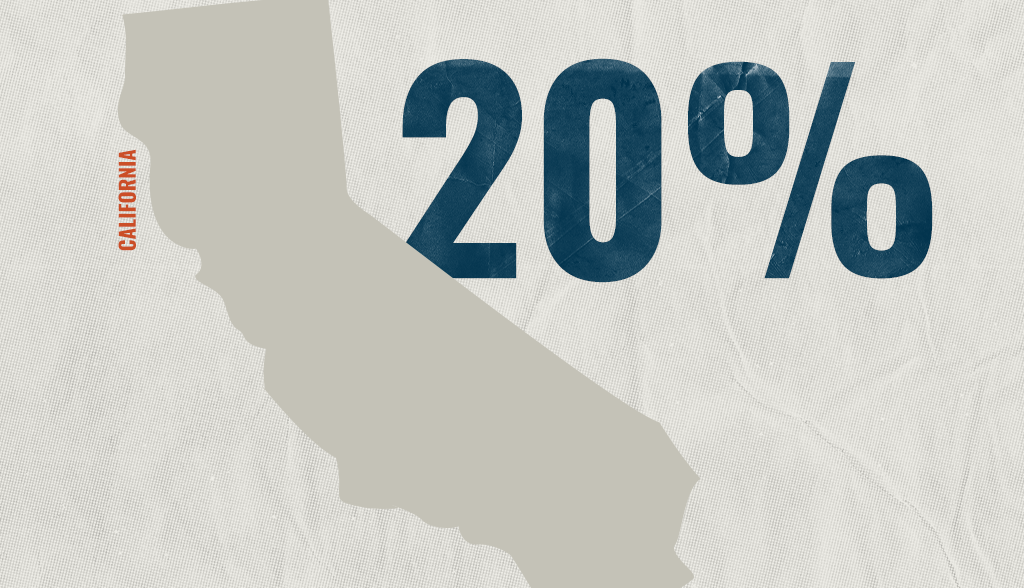
California makes up 20% of the national WC market. On July 25, 2024, the WCIRB California released its “2024 State of the System” report, which includes the following key metrics about the California WC system:
| • | The projected calendar year combined ratio for 2023 is 92%, which is higher than countrywide ratios for the past three years. |
| • | The projected accident year combined ratio increased by two points to 111% in 2023, the fourth consecutive year of a combined ratio above 100%. |
| • | Average indemnity costs continue to increase, primarily driven by increasing average wage levels, plateauing settlement rates and longer average duration, with increases projected through 2026. |
| • | Average allocated loss adjustment expense costs rose sharply in 2022 and 2023, driven by increased litigation across the state. |
Claim volume
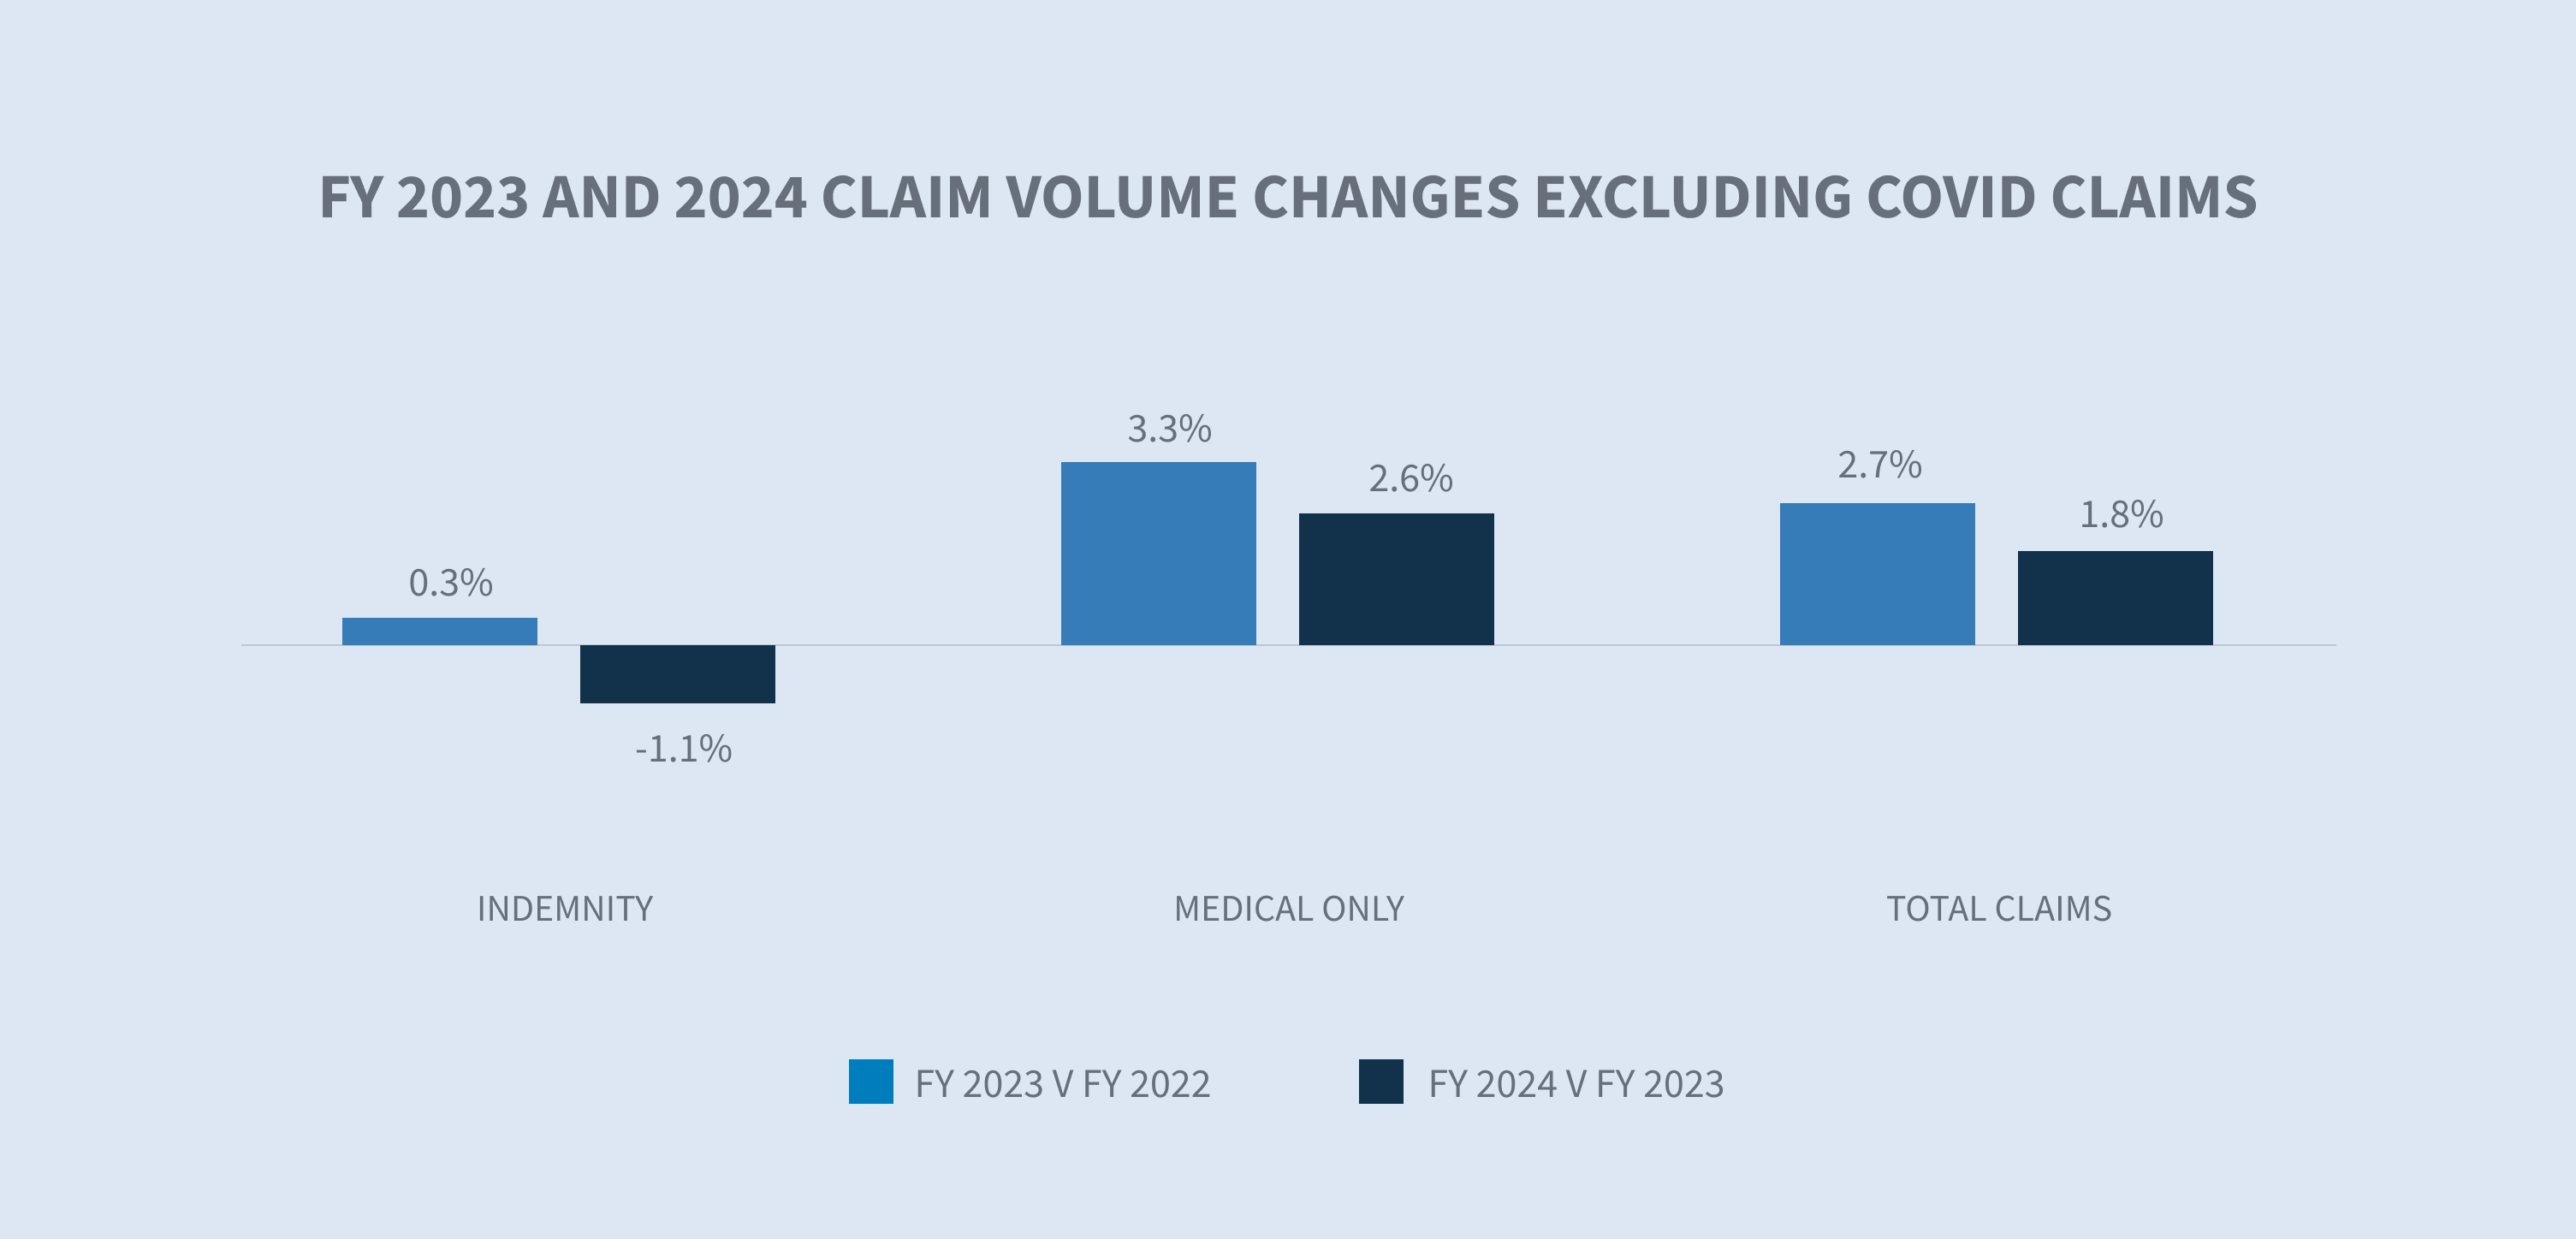
Sedgwick’s data for FY 2024 reflects a 0.6% decrease in total claim count compared to 2023 when COVID-19 claims are included.

Excluding COVID-19 claims, Sedgwick saw a 1.8% increase in total claim count from 2023.
Sedgwick’s FY 2024 volumes reflect the moderation of employment gains in the U.S. labor market with unemployment climbing to 4.3% from 3.5% a year earlier. Additionally, more than three years into the pandemic, the number of COVID-19 cases and fatalities remain low despite a recent uptick.
From a labor market perspective, employment varies by industry as well as jurisdiction. According to the Bureau of Labor Statistics (BLS) “Employment Situation Summary” published Aug. 2, 2024, employment continued to trend up in healthcare, construction, and transportation and warehousing. Sedgwick’s claim counts only increased in 2024 for the carrier, construction, paper products and transportation industries.

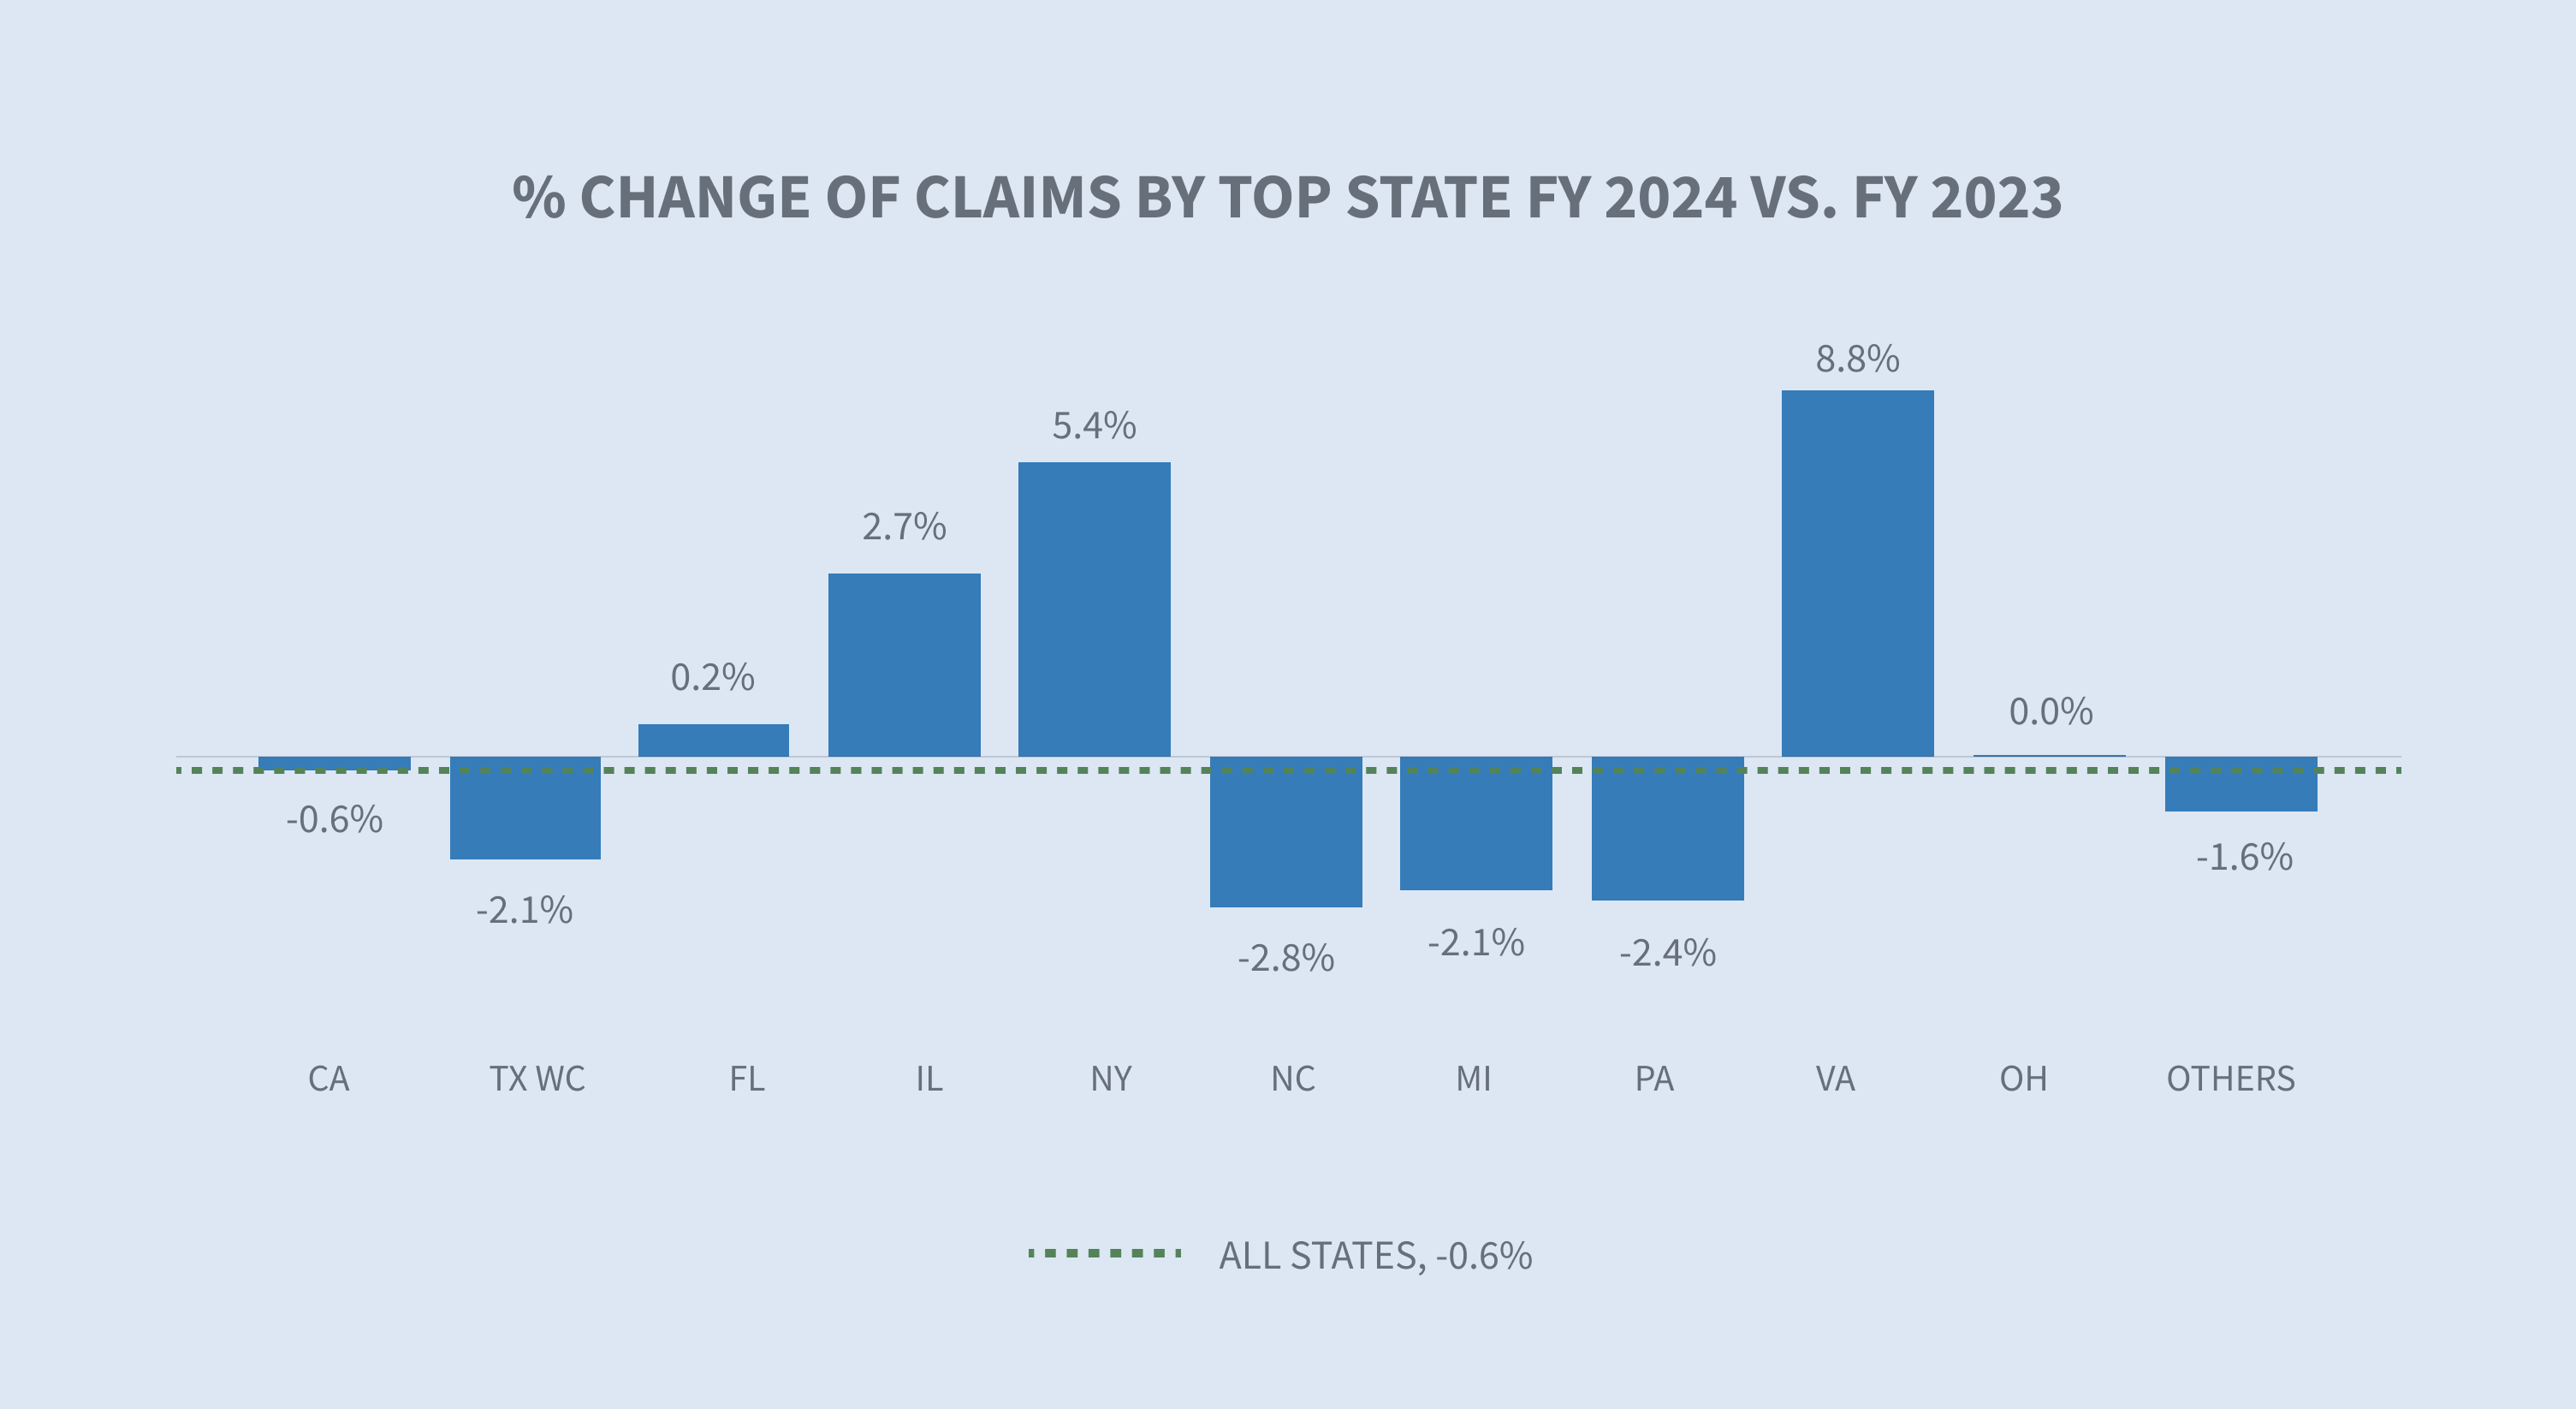
“The Economics Daily” report from BLS, published July 29, 2024, reported that Texas, California and Florida had the largest job gains from June 2023 to June 2024. The largest percentage changes in employment occurred in South Carolina, Missouri and Nevada. Sedgwick’s data reflects the largest percentage change in claim volume occurring in Virginia, Texas and New York.
The share of indemnity claims continued to decrease in FY 2024 by 0.3% and is approaching pre-pandemic levels.

* AAPC = Annual average percentage change
* NCCI normalizes data with employee counts or payroll.
* WCIRB report normalizes the data with employee counts or payroll.
Claim costs
Indemnity
The average paid per indemnity claim increased 10.2% in FY 2024 when compared to FY 2023.
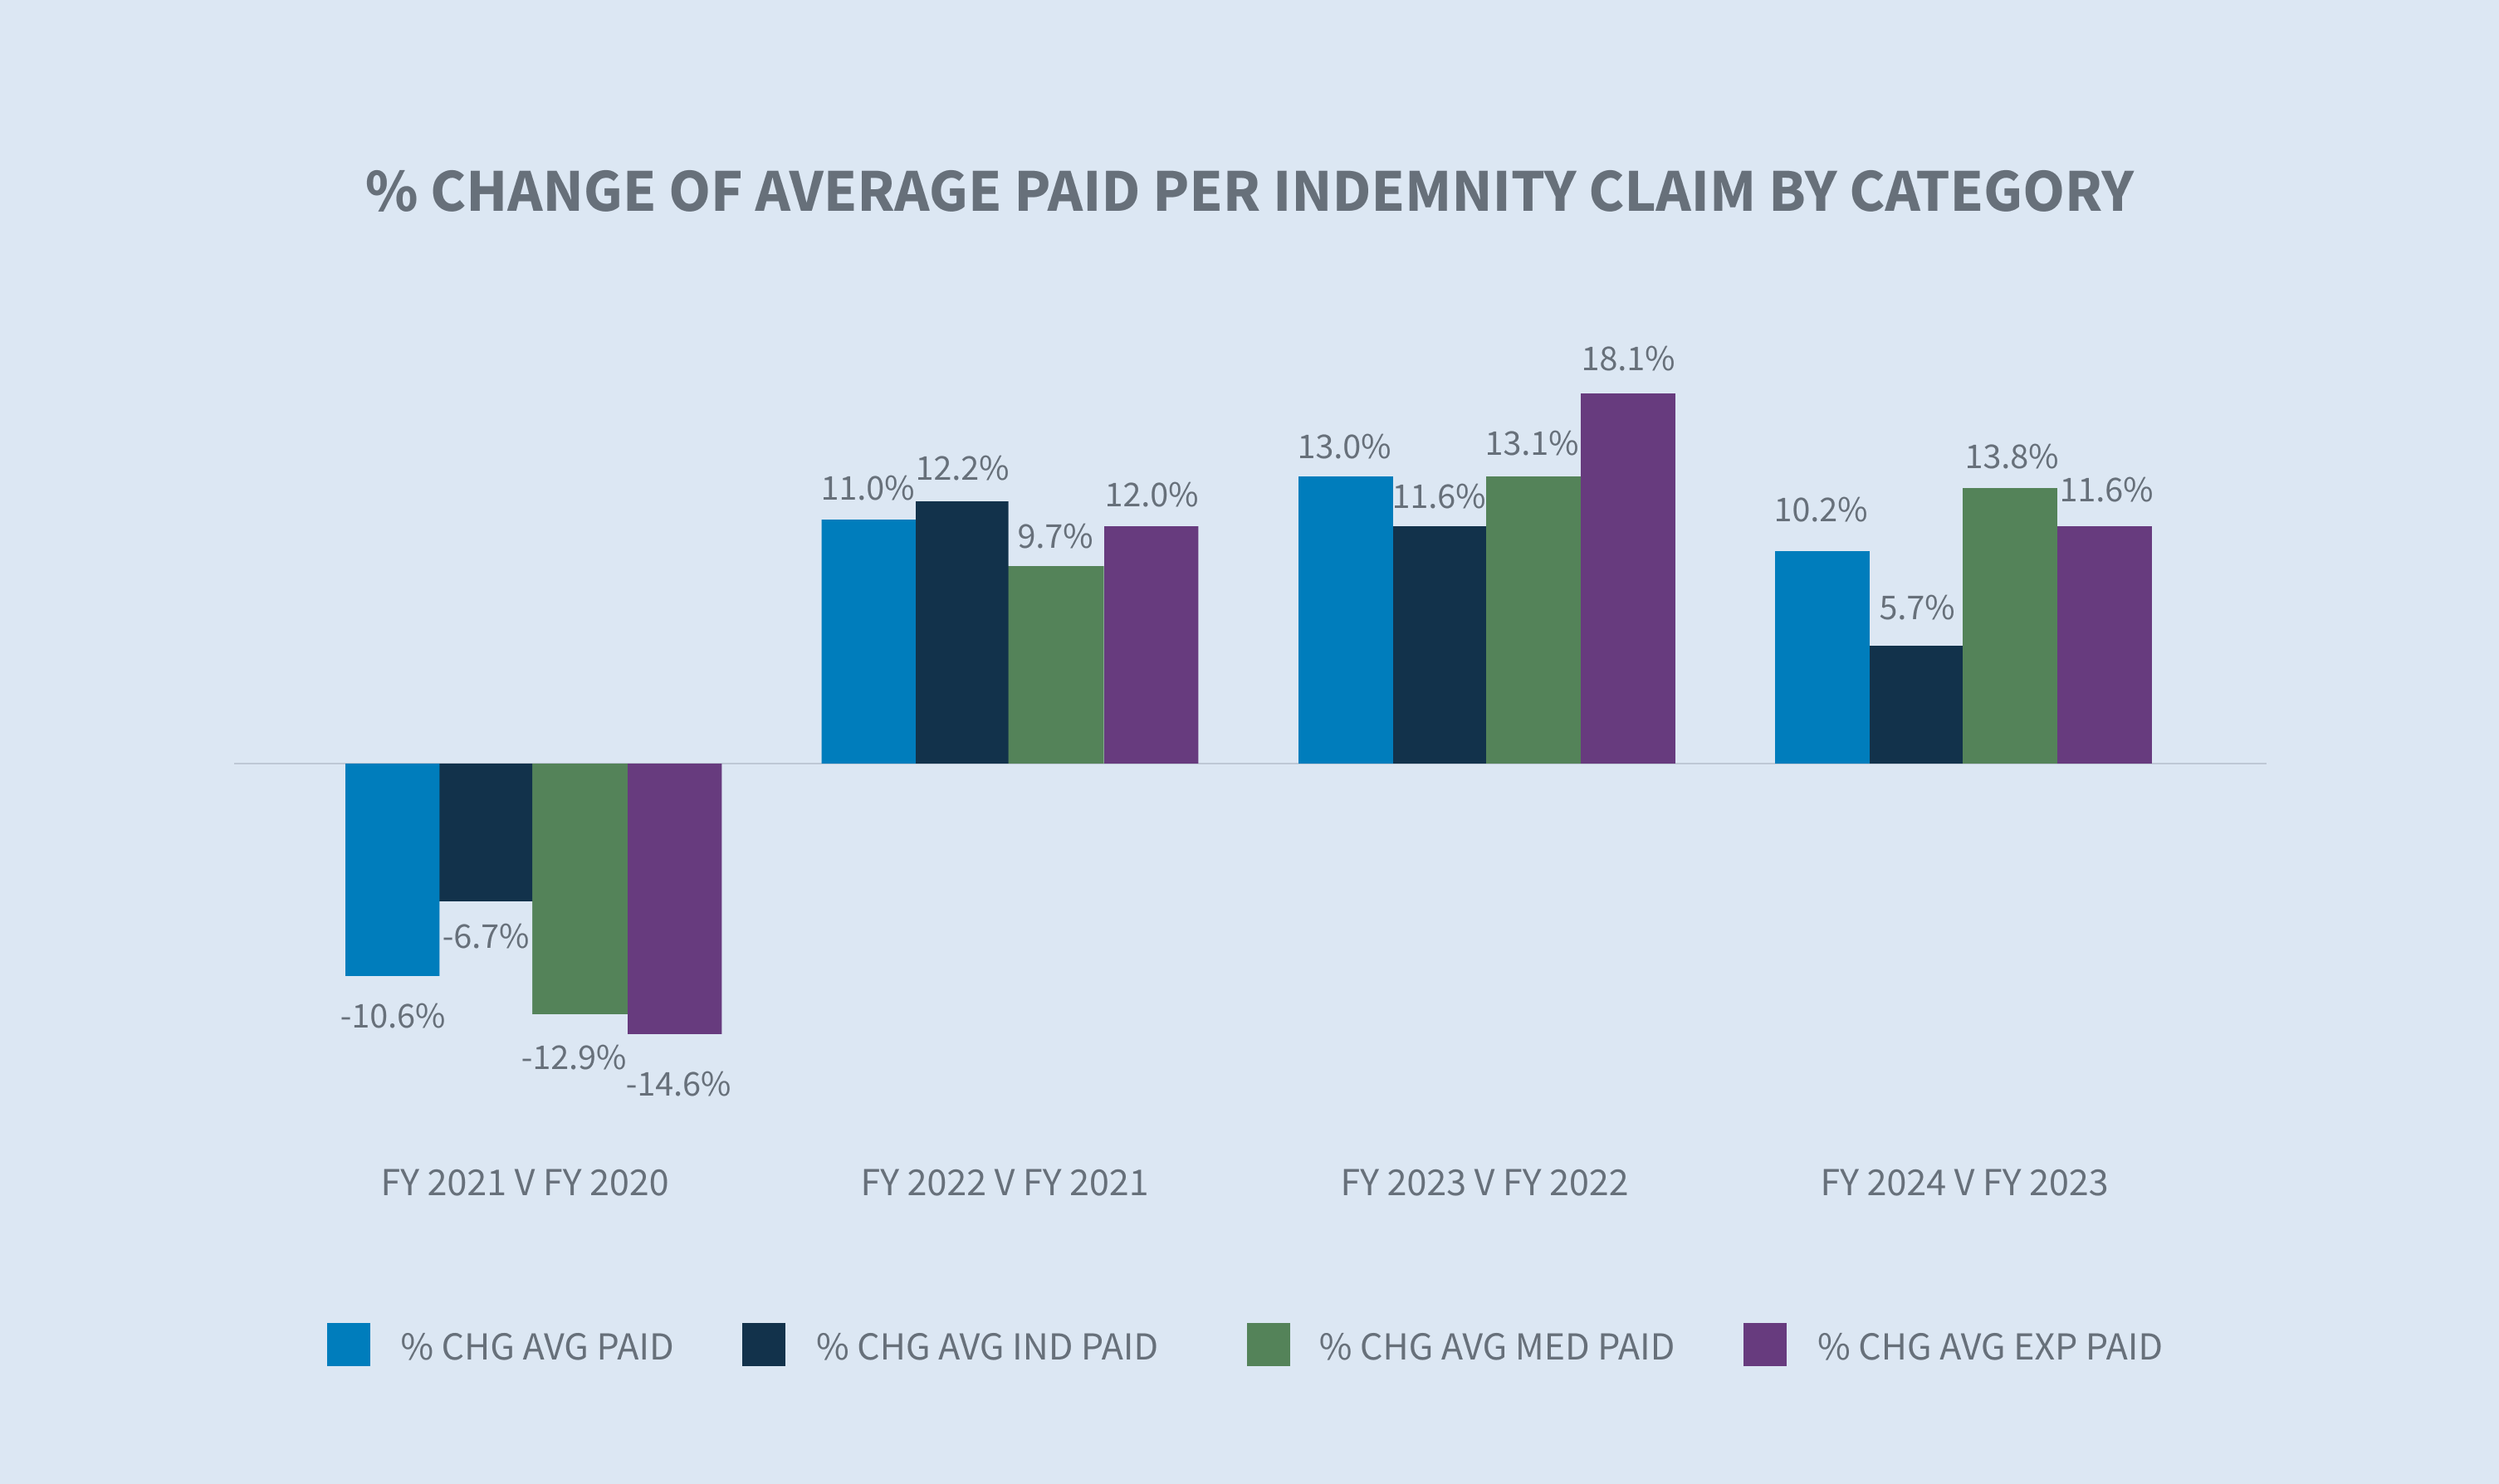
Excluding COVID-19 claims, there was a 9.4% increase in the average paid per indemnity claim in FY 2024 from FY 2023. The average paid for COVID-19 claims minimally drives down the average paid per indemnity claim. This reflects the diminishing effect that COVID-19 claims have on the average paid per indemnity claims.
The state filter in the average weekly wage (AWW) inflation tool allows comparisons of the AWW by state. According to the BLS “Employment Cost Index” issued July 31, 2024, wages and salaries increased 6.5% for union workers for the 12-month period ending in June 2024 and 3.8% for non-union workers. In 2024, 22 states increased their minimum wage according to the Economic Policy Institute minimum wage tracker, raising pay for an estimated 9.9 million workers.
It is noteworthy that most states annually index their maximum indemnity benefit to the state average weekly wage (SAWW) to prevent inflation from eroding the level of the workers’ benefits. Accordingly, indemnity benefit costs will vary by jurisdiction.
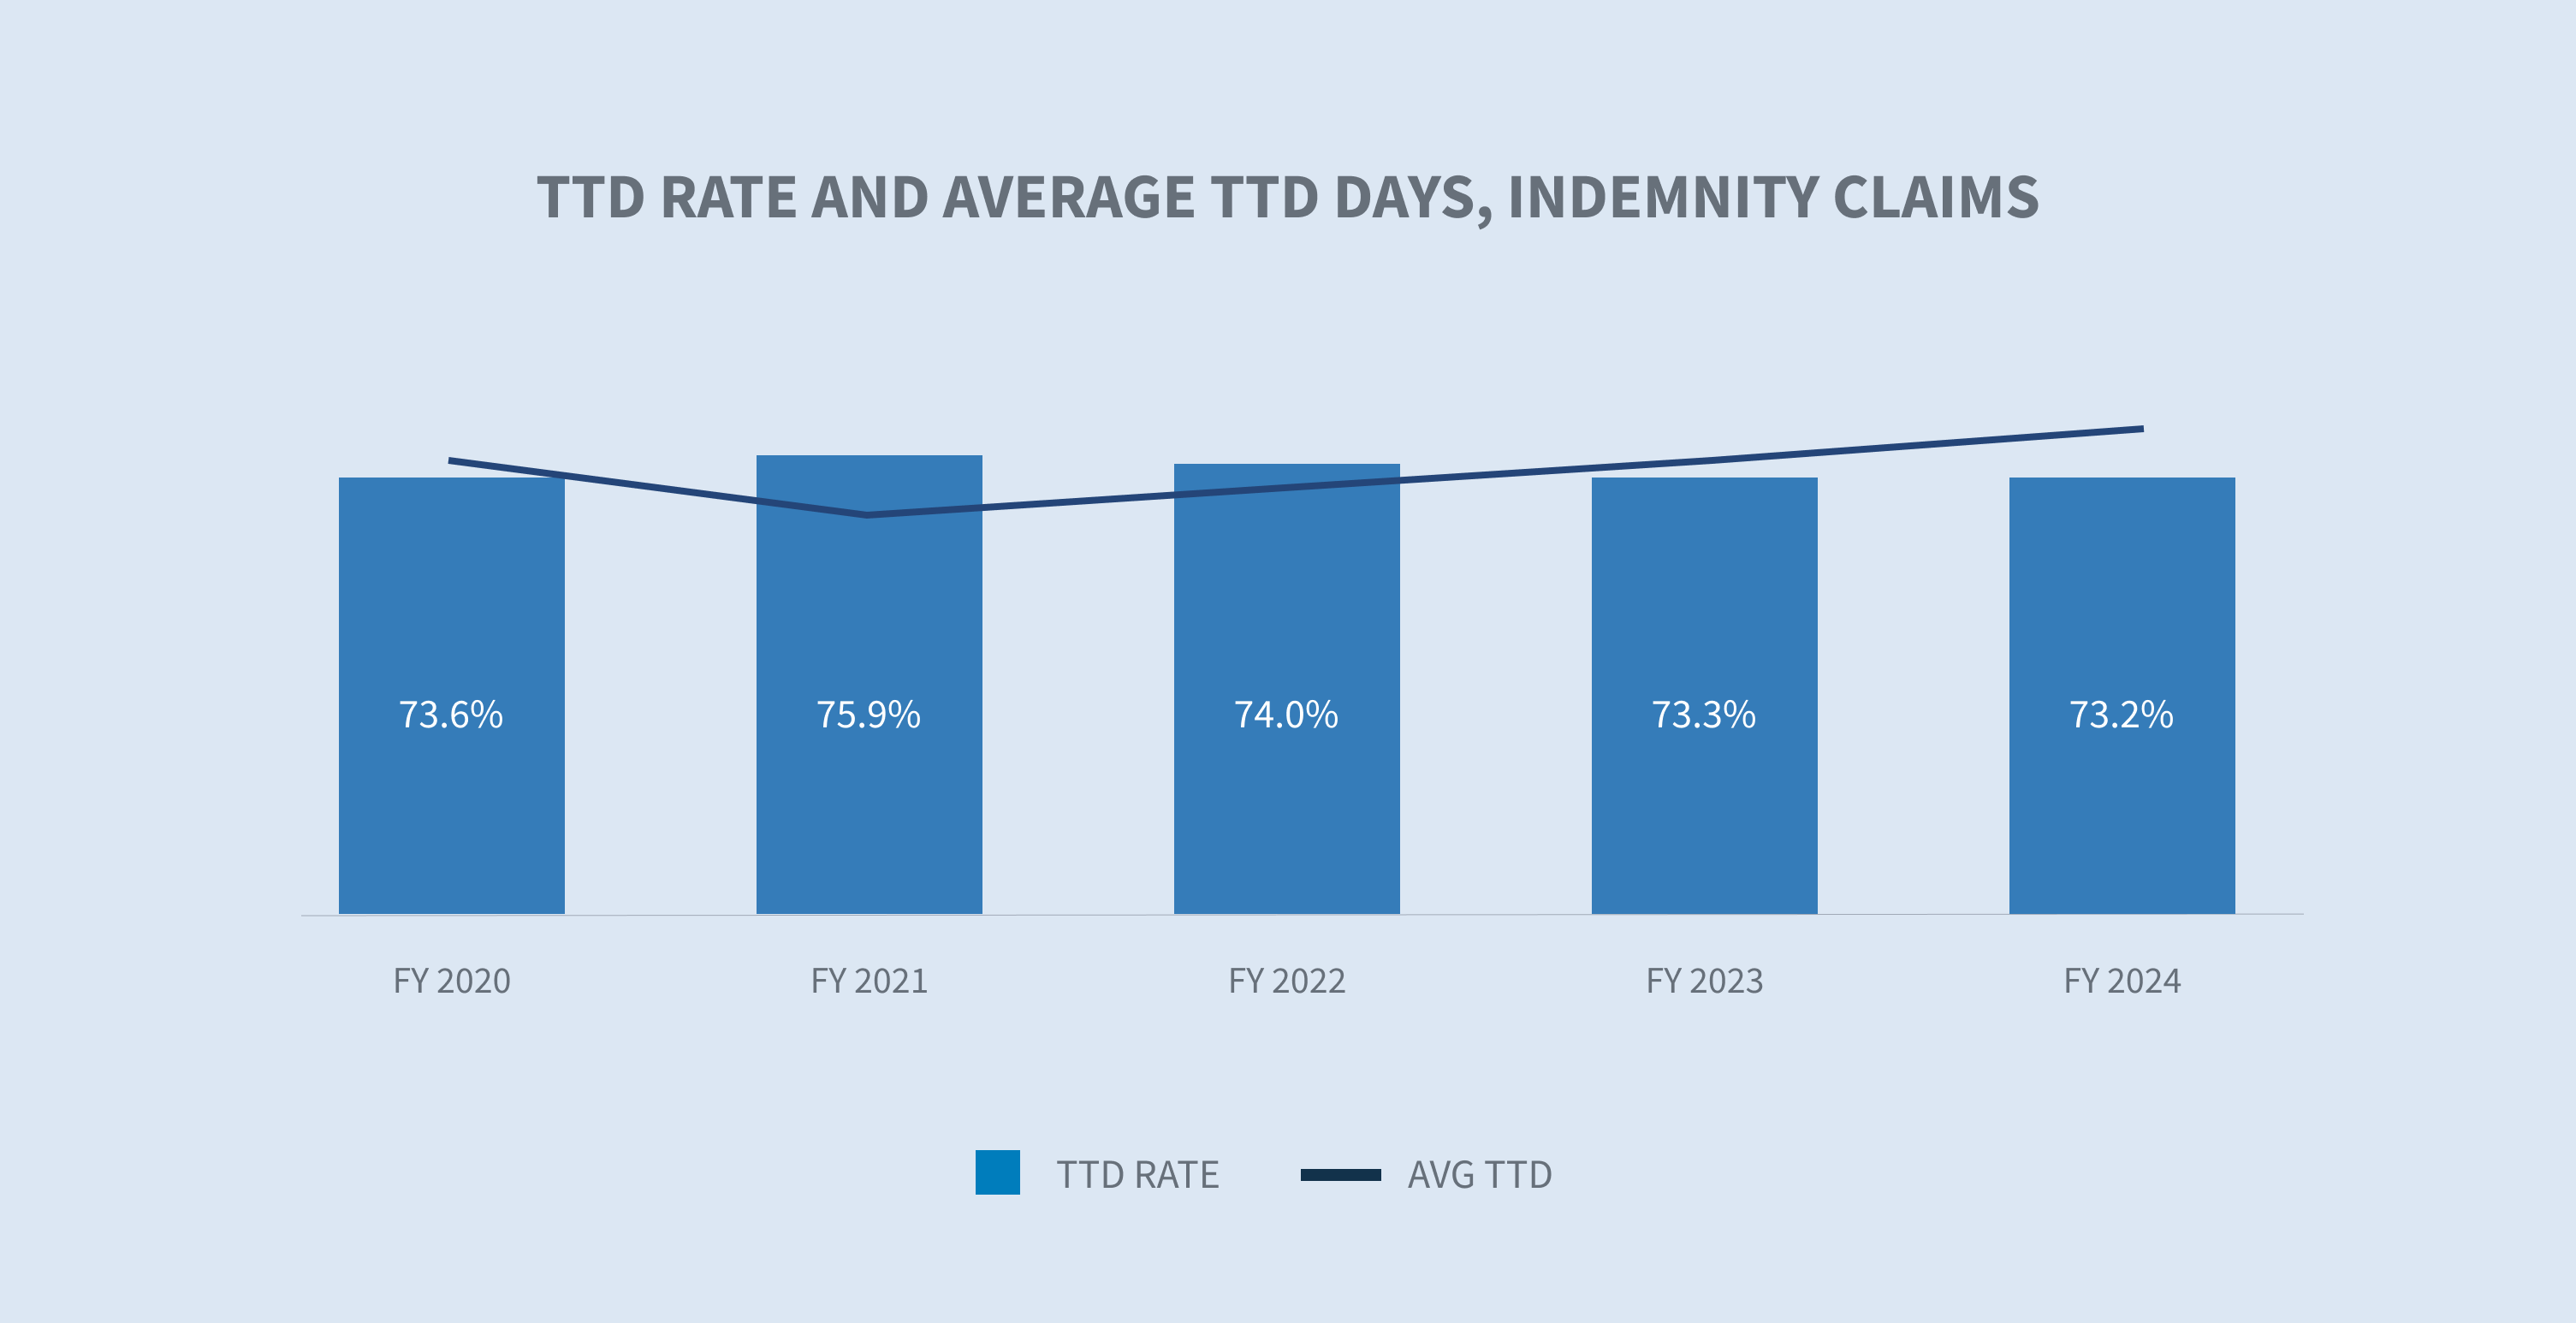
Indemnity benefit payments, which are calculated based on wages earned, increased by 5.7% per indemnity claim in 2024. Our temporary total disability (TTD) paid per day inflation analysis indicated a 3.8% increase for FY 2024 compared to FY 2023. The construction (+10.9%), public sector (+5.2%) and transportation (+5.1%) industries experienced the largest increases.

The rate of indemnity claims with at least one day of TTD payments declined in both FY 2023 and FY 2024, reflecting a system normalization to pre-pandemic levels.
Medical costs
Average medical services paid per indemnity claim increased 9.5% in FY 2024 relative to FY 2023.
Medical costs are primarily driven by a combination of utilization and price. The price component of medical payments under the WC system is highly regulated by each state, resulting in substantial differences in prices paid for medical services across states. Our medical inflation analysis indicated a 3.1% increase in the price per service change between FY 2023 and FY 2024.
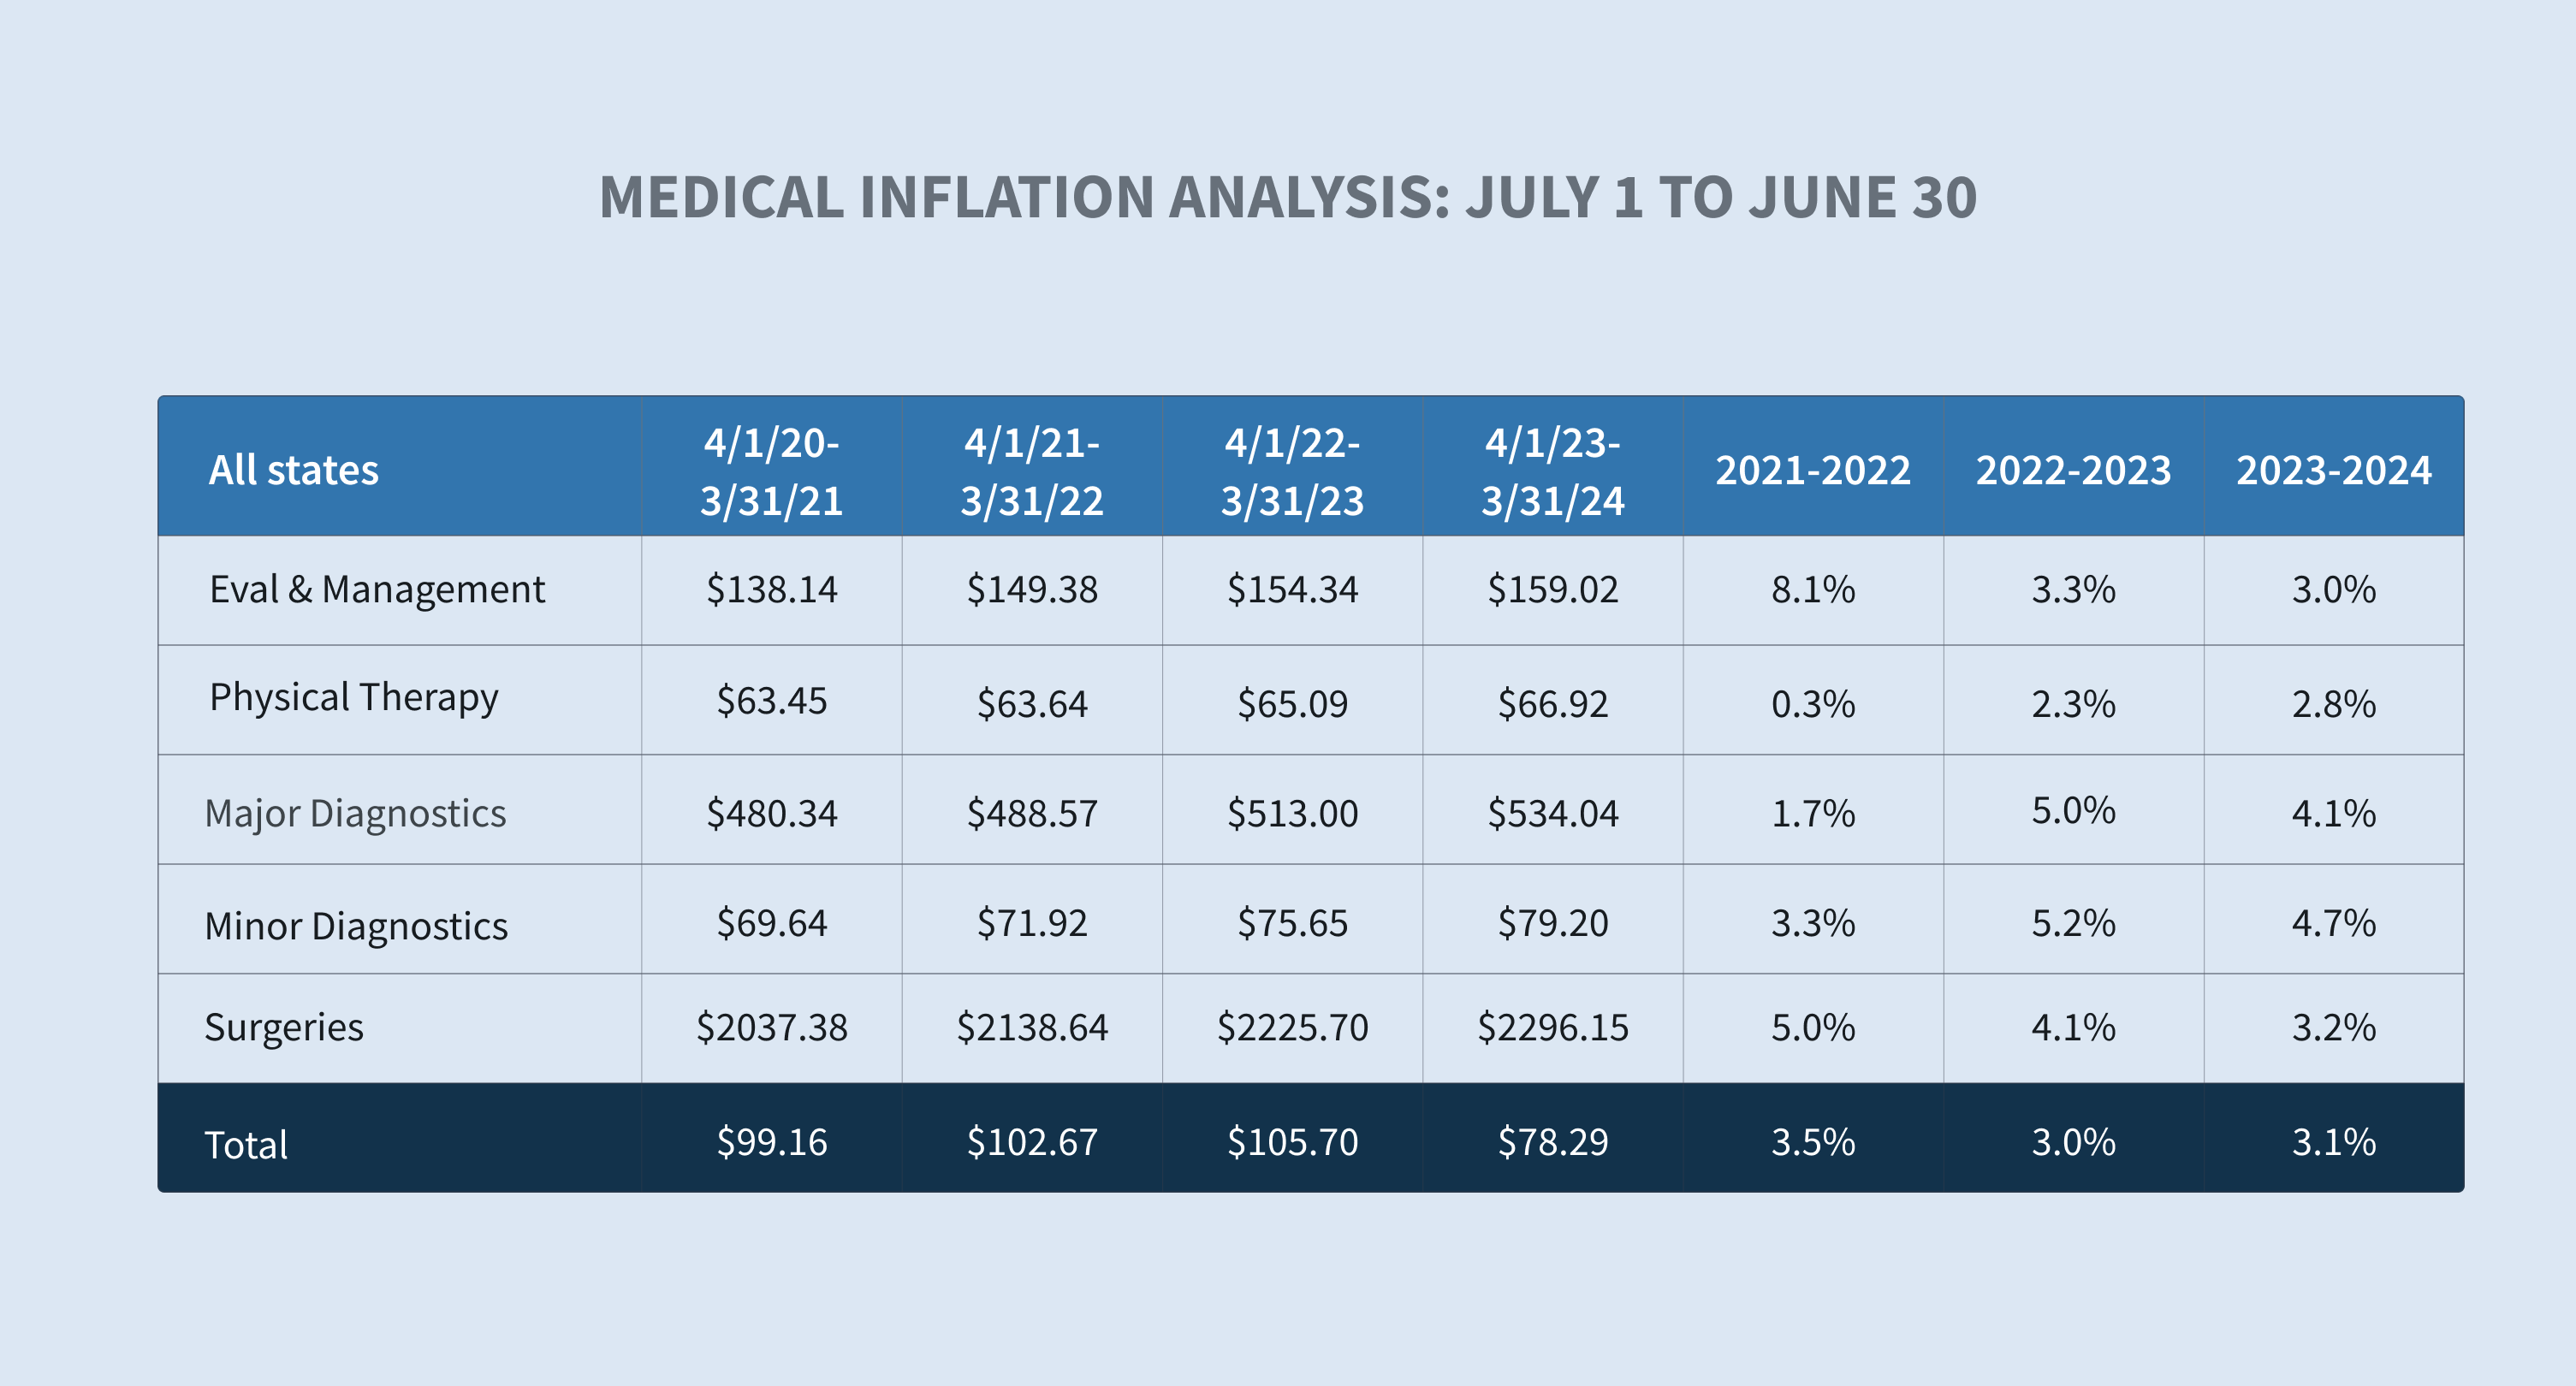
Physician services categorized as evaluation and management, physical therapy, surgery and radiology continued to be the primary drivers of growth in average medical costs paid in 2024.
While most WC medical costs are controlled by state fee schedules, services not covered by fee schedules, like durable medical equipment, attendant care, long-term care and transportation, are seeing significant cost increases.

Our data shows a 10.4% increase in the average paid for pharmacy from FY 2023 to FY 2024 driven by:
| • | High-dollar topical agents typically dispensed outside of pharmacy networks |
| • | Increases in average wholesale prices for certain drugs |


Providers are pushing for fee schedule revisions to cover their increasing labor and material costs, and states are responding. For example, Florida Senate Bill 362 increases the maximum reimbursement allowances (MRA) for physicians from 110% to 175% and increases the MRA for surgical procedures from 140% to 210% of the reimbursement amount allowed by Medicare.
Sedgwick’s average medical services paid per indemnity claim for FY 2024 cannot yet be compared with the industry.

Closures
The percentage of all claims closed in FY 2024 stayed consistent with a slight increase in the overall and indemnity closure rates. On average, COVID-19 claims closed more quickly than non-COVID-19 claims.


The duration of indemnity benefits, another component of indemnity costs, was stable in FY 2024 when compared to FY 2023.
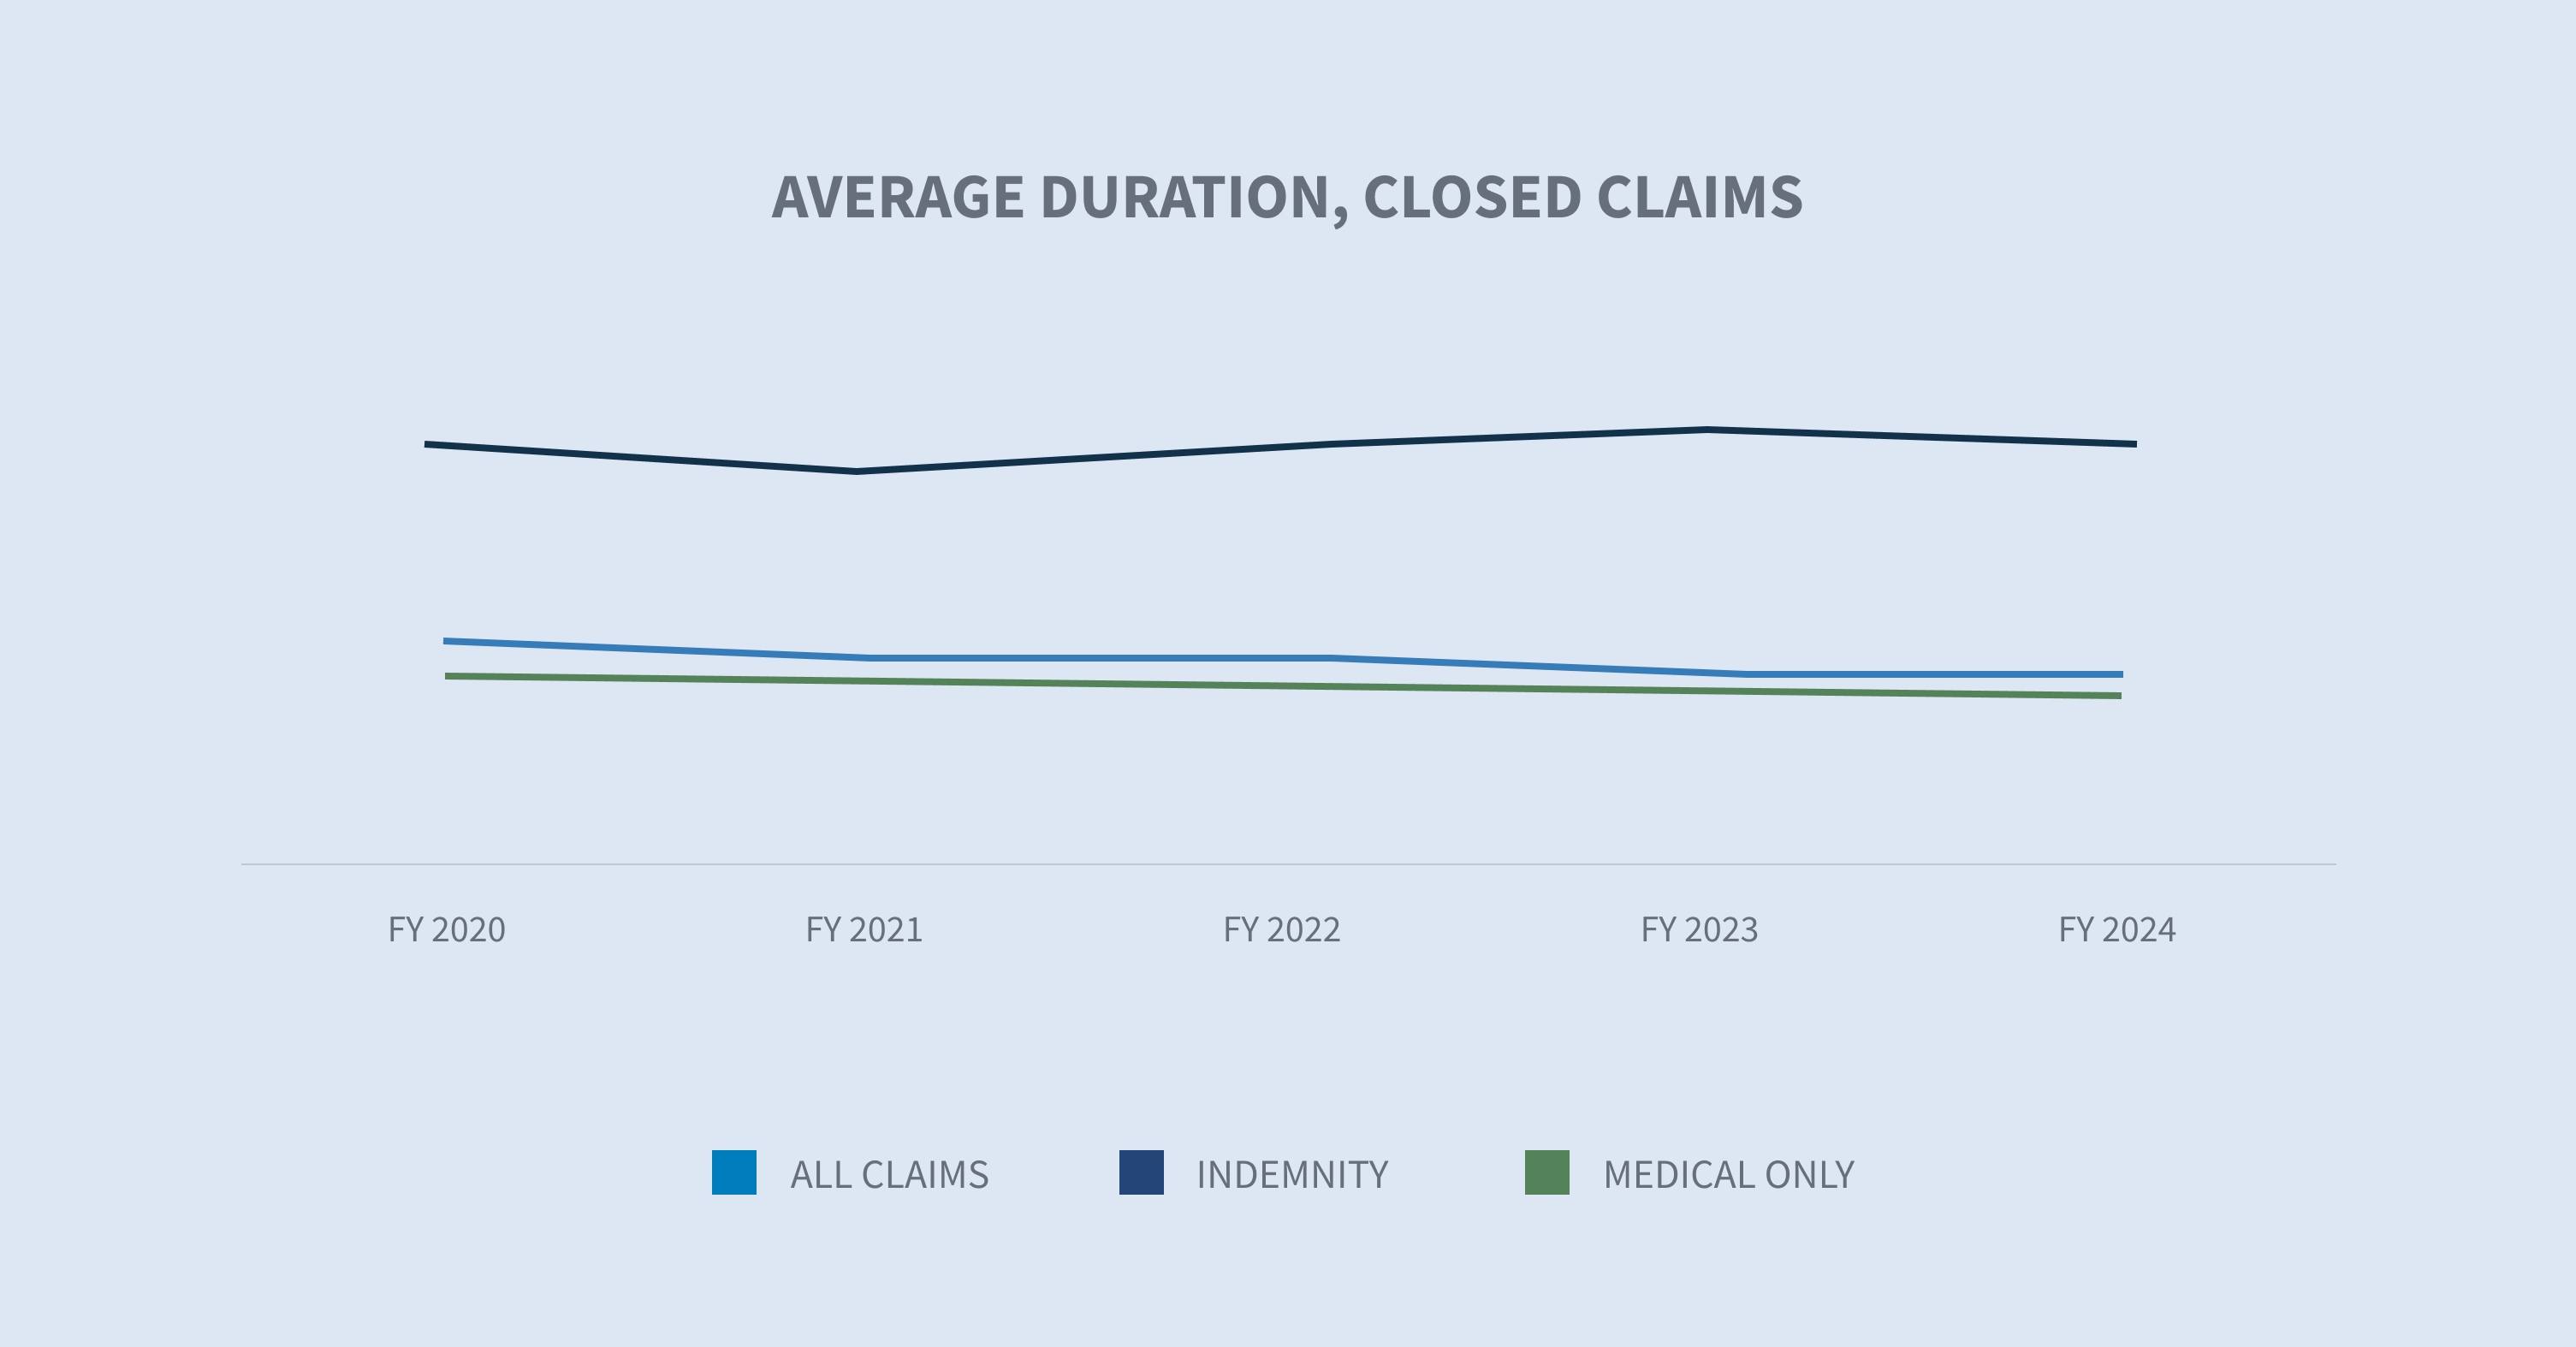
According to the WCIRB “2024 State of the System” report, California continues to experience longer average claim duration compared to other states. This is driven by slower claim reporting, lower settlement rates and higher frictional costs, particularly medical-legal costs.
Expense costs
Allocated lost adjustment expense (ALAE) costs per indemnity claim are driven by three major categories:
| 1. | Average medical cost containment program costs |
| 2. | Legal fees |
| 3. | Medical-legal |
While average expenses paid increased in each of these categories, medical cost containment (+9.6%) and legal fees (+8.2%) reflected the largest increases.


Defense attorney fees make up 83% of legal fees and the average paid increased approximately 6% in FY 2024.

In FY 2024, claim litigation rates for indemnity claims increased, showing a steady increase in the post-pandemic era. The WCIRB California “2024 State of the System” report shows a sharp rise in average allocated loss adjustment expense driven by increased litigation across the state.
Since litigated claims historically cost more, increases in the litigated rate per claim result in increased indemnity and medical costs.
Future considerations
WC is witnessing transformative changes that are being closely monitored.
Labor market shifts
The COVID-19 pandemic resulted in labor market shifts and wage changes that have undoubtedly impacted WC.
Shortened average job tenure due to workers moving into new jobs, occupations and industries tends to increase injury frequency and may also affect injury severity as injury rates vary across industries. NCCI suggests that this increase may be offset by the lower frequency of job-related injuries experienced by remote workers.
Over the past three years, several states have enacted legislation to loosen restrictions on which occupations minors from 14 to 17 years old are allowed to work, as well as the number of hours they are allowed to work. According to NIOSH, these young workers have high rates of job-related injuries.

Demographic shifts, such as a change in the age distribution of workers in certain industries due to early retirement, may also affect injury frequency and severity. According to a Pew Research study, roughly one in five Americans aged 65 and older (19%) were employed in 2023 — which is nearly double the share of those who were working 35 years ago. Women represent 46% of all workers aged 65 and older.
As these labor trends continue, attention to safety, training and return to work programs become more important than ever.
Medical accessibility/costs
Medical costs and severity are expected to increase in the future driven by various factors.
The National Center for Health Workforce Analysis estimates a shortage of up to 81,180 full-time physicians in 2035. There is also a projected shortage of registered nurses (RNs) through 2030. These projected healthcare shortages will inevitably impact healthcare accessibility, especially in non-metropolitan areas. Sedgwick data is already showing slight increases in the lag between the date of loss and the first service date(s) of certain medical treatments, with variation in results by state.
Increased use of nurse practitioners (NPs) and physician assistants (PAs) is expected to mitigate shortages in some specialties. These professions, including RNs, are expected to have excess by 2035.
Another factor impacting medical accessibility and costs is consolidation in the healthcare market. WCRI’s recent “Impact of Vertical Integration in Workers’ Compensation” study found that workers receive more medical care and see more providers. This leads to higher medical payments per claim and longer duration of temporary disability when treated by physicians at sites owned by hospitals and health systems.
Medical advances are often effective in improving outcomes, but they tend to be costly. One example is the introduction of new single-source brand drugs that do not have an equivalent generic drug available on the market, such as the GLP-1 agonists class of weight loss drugs known under the brands Ozempic and Trulicity or the migraine medication Aimovig.
HEIGHTENED REGULATORY ENVIRONMENT
Legislatures convened this year in all states except Montana, Nevada, North Dakota and Texas to enact numerous bills that directly affect the management and costs of WC claims.
Several states enacted legislation that increased WC benefits for injured employees, although this applied to only first responders in Colorado, Florida and Ohio.
Multiple states expanded presumptions for first responders to either add additional conditions or make additional first responders eligible. These laws historically are applied to local public entities or certain state and federal agencies; although, they sometimes apply to some private sector employees or volunteers.

Penalty exposure continues to increase due to enacted legislative and regulatory changes, along with enhanced electronic monitoring of performance.
Meanwhile, leadership within state WC agencies has recently changed in several states, with more changes anticipated due to retirements and the upcoming election.
2024 ELECTIONS
Insurance is primarily regulated at the state level, so state elections tend to impact the industry more directly. In 2024, gubernatorial elections will occur in 11 states and two territories: Delaware, Indiana, Missouri, Montana, North Carolina, North Dakota, New Hampshire, Utah, Vermont, Washington, West Virginia, American Samoa and Puerto Rico. Additionally, insurance commissioners are being elected in Delaware, North Carolina, North Dakota and Washington.
The following state ballot initiatives are also being closely monitored:
| • | Alaska: Minimum wage increase and paid sick leave initiative |
| • | Massachusetts: Increased minimum wage for tipped employees |
| • | Florida: Amendment 3, legalization of adult use of marijuana |

IMPACT OF FEDERAL REGULATIONS
Although WC in the U.S. is largely controlled and administered at the state level, legislation and court decisions at the federal level sometimes impact the state WC system.
Independent contractor rule
On Jan. 10, 2024, the U.S. Department of Labor (DOL) announced the publication of a final rule that rescinds the independent contractor status under the Fair Labor Standards Act (FLSA 2021 IC Rule). On March 11, 2024, it replaced it with a six-factor analysis used by courts to determine whether a worker is an employee or an independent contractor.
The final rule only revises the DOL’s interpretation under the FLSA and has no effect on other laws — federal, state or local — that use different standards for independent contractor classification, including state WC laws.
There are currently at least four legal challenges to this rule, and congressional bills have been introduced. The impact of this rule change on state WC, if any, is uncertain.
Salary and compensation levels
On April 23, 2024, the DOL announced a final rule, “Defining and Delimiting the Exemptions for Executive, Administrative, Professional, Outside Sales, and Computer Employees”, which took effect on July 1, 2024. This rule increased the salary thresholds for the FLSA’s overtime exemptions for executive, administrative, professional (EAP) and highly compensated employees and provided a mechanism to update the salary thresholds. It is estimated that this new rule will impact 4.3 million workers.
Increasing salaries of exempt workers will increase WC premiums based on the employee’s classification as well as indemnity benefit exposure. However, it is important to note that with the exception of four states (Delaware, Pennsylvania, Nevada and Utah), overtime pay can be reduced to straight time when determining the WC premiums, and overtime is not always included in the AWW determination.
COURT DECISIONS
In the U.S. system, courts have the sole power to interpret the law, determine the constitutionality of the law and apply it to individual cases when there are disputes. Often, these decisions have far-reaching implications.
On June 28, 2024, the U.S. Supreme Court decision in Loper Bright Enterprises v. Raimondo (No. 22-451) overruled a long-standing requirement dating back to 1984, the Chevron doctrine, that courts must defer to federal agencies’ reasonable interpretations of ambiguous statutes. The high court held that the Administrative Procedure Act (APA) requires courts to exercise their independent judgment in deciding whether an agency has acted within its statutory authority.
This decision will have a significant impact on how lower courts will evaluate challenges to any regulation issued by any regulatory agency, including:
| • | New DOL regulations |
| • | New Federal Trade Commission non-compete agreement ban |
| • | New OSHA Heat Injury and Illness Prevention in Outdoor and Indoor Work Settings standard |
| • | Centers for Medicare and Medicaid Services methods of protecting Medicare’s interest in WC cases |
| • | Interpretation of the Longshore Act and its extensions by the Director of the Office of Workers’ Compensation Programs |
A risk to monitor is the potential for inconsistency due to different courts interpreting the same regulation differently.