
- Summer 2024: CASUALTY
Auto liability
Report objectives
This report aims to summarize the present metrics for our auto liability (AU) programs, assess the landscape of AU claims and litigation, and benchmark our patterns against comparable industry research.
data parameters
Our practice team uses JURIS claims data to perform comparative analyses informed by their expertise and analytics. The data in this report is based on both insured and self-insured claims for all states across five, 12-month periods (referred to as FY) from July 1, 2020, through June 30, 2024.
Key observations
New AU claim volume is up 7.4% in FY 2024, with transportation claims driving the new AU bodily injury (BI) claim volume rate of 12.5%.
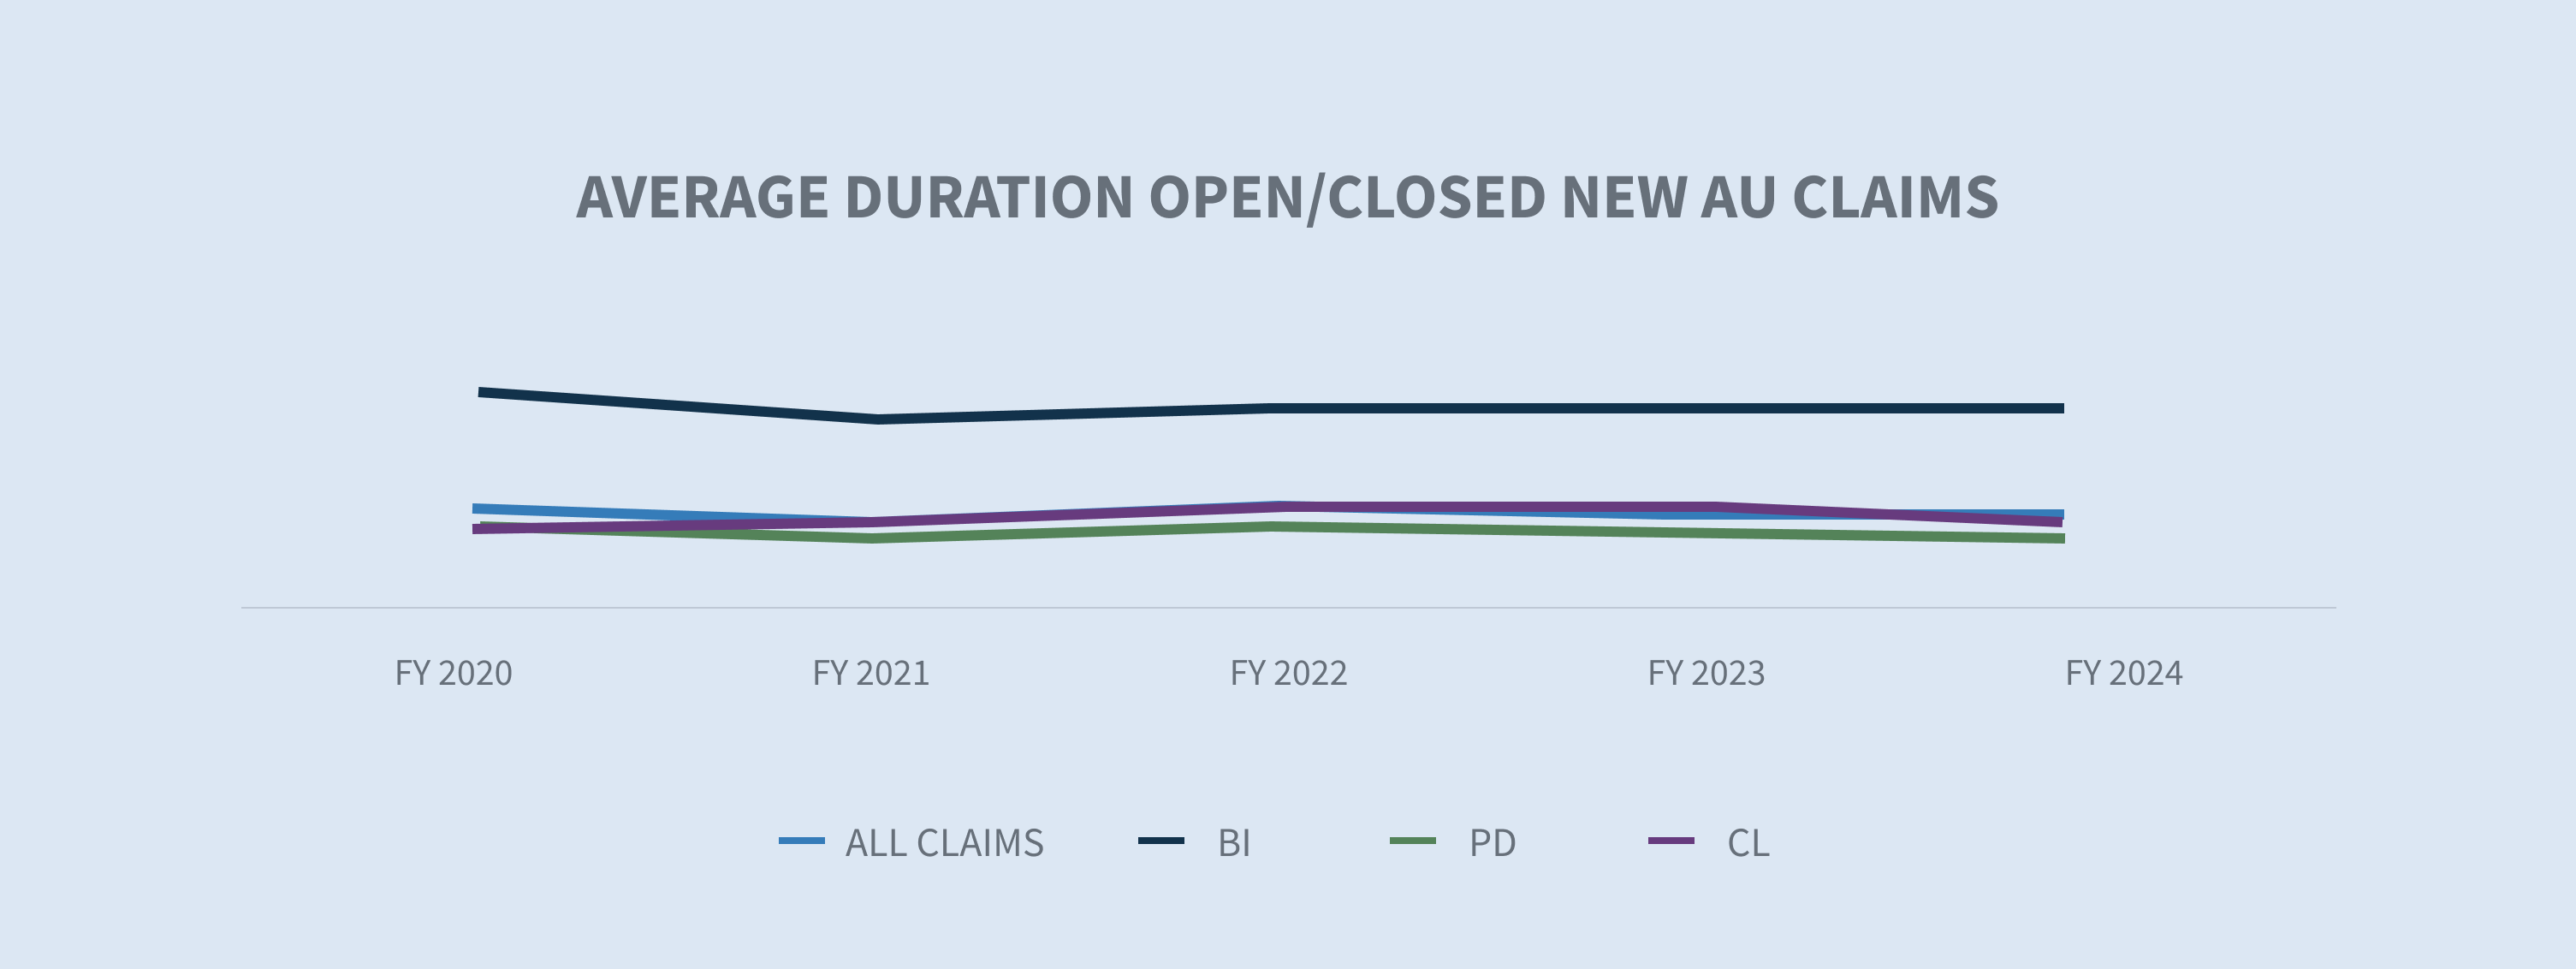
AU new claim durations decreased in FY 2024. Open/closed AU BI new claim duration decreased by one day. Open/closed AU property damage (PD) new claim duration decreased by three days.
The average paid on new auto claims rose 5.9% in FY 2024.
Closure rates on new AU BI claims increased 3.4% in FY 2024.
The litigation rate for all new AU claims decreased by 16%, with the largest decreases in Florida driven by the post-tort reform litigation environment.
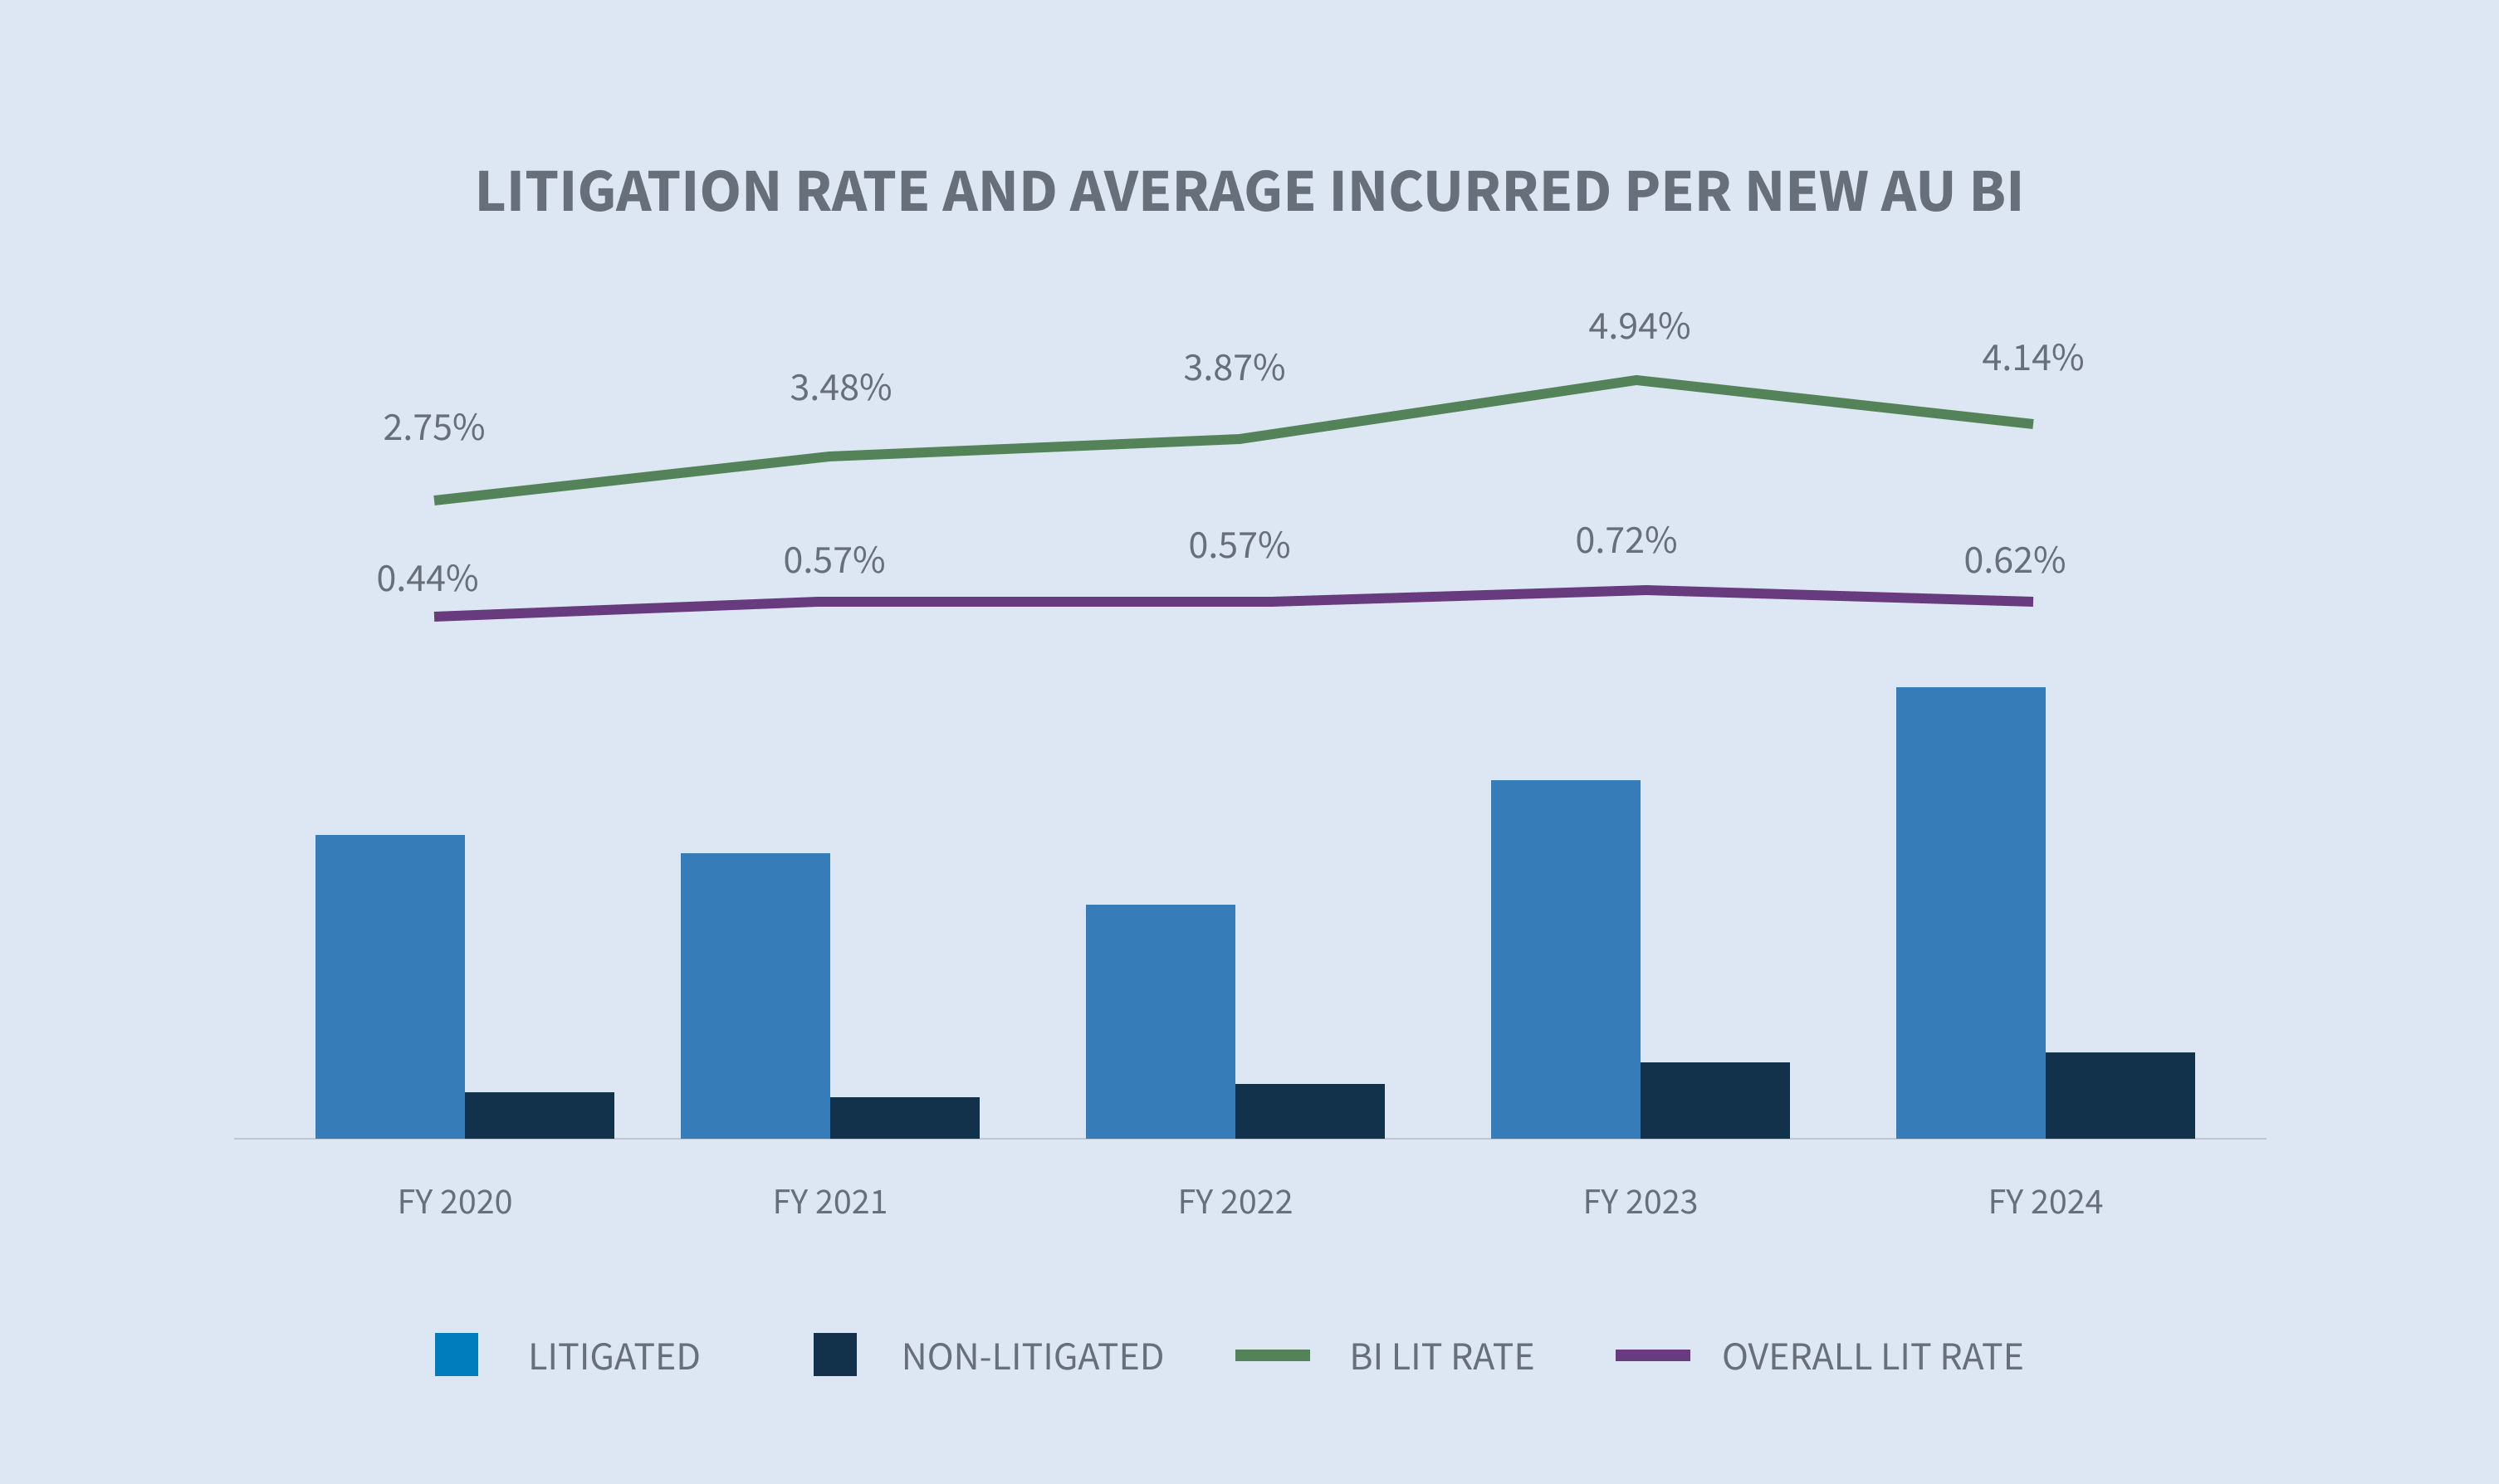
The average incurred for new litigated AU BI claims increased 25% in FY 2024 compared to FY 2023. The average incurred for new non-litigated claims increased 7.5%.
Closed AU claims with incurred above $100,000 represent 2.1% of all closed claims in FY 2024 but 69.3% of all incurred.
Fifty-nine percent of all auto claims that ultimately become litigated have representation in place at the time of notice and within 24 hours of receipt by Sedgwick — an increase of 1% in FY 2024 when compared to FY 2023 and an increase of 18% over the last five years.
Aged pending decreased to 11.9% in FY 2024.
Closed litigated claims increased by 16.5%, accounting for approximately 3.98% of all closed auto claims and comprising 53.7% of the total paid.
Market
MarketScout reports that U.S. commercial insurance rates rose 3.9% in Q1 2024, driven by auto, property and cyber insurance, with transportation seeing the highest increases at 6.7%.
The Council of Insurance Agents and Brokers notes that commercial auto premiums increased by 9.8%, with experts suggesting that the increases were driven by vehicle repair cost inflation, rise in nuclear verdicts and an increase in accident rates.

The risk for nuclear verdicts extends across industries but is exceptionally high in commercial auto, product liability, directors/officers, malpractice and professional liability cases, according to Marsh McLennan.
The recent Chevron doctrine decision (Loper Bright Enterprises v. Raimondo, Department of Commerce, et al.) creates uncertainty that will likely result in more litigation.
Volume
New claim volume has increased 7.4% in FY 2024, following subsequent volume increases of 7.6% in FY 2022 and 10.6% in FY 2023.

The five states with the highest volume represent 41% of all new auto claims, with New Jersey seeing the largest increase at 89%. Overall, new auto claims increased by 7.4% countrywide.

The top five industries represent 88% of the total claim volume. Carrier claims were the main driver of AU claims, representing approximately 30% of the overall new claim volume. Services increased by 10.2% in FY 2024.

The overall BI rate in FY 2024 for new auto claims increased slightly to 12.5%. Transportation (15.8%), carrier (13%), manufacturing (12.6%) and services (11.1%) all experienced double-digit BI rates, while food and beverage (7.4%) and retail (9%) experienced single-digit BI rates. However, all industries saw an increase in the BI rate in FY 2024.

The overall PD rate in FY 2024 decreased slightly to 55.9%.

The average incurred for denied new claims decreased 46% in FY 2024 compared to FY 2023. However, FY 2023 was an exceptional year for denied average incurred after having risen 110% from FY 2022. Non-denied (accepted) new claims average incurred rose 10% from FY 2023. The denial rate in FY 2024 increased to 15.4%.

Claims durations continue to decrease for both open/closed claims (down two days) and closed claims only (down three days).

Costs
The average incurred for all new AU claims has been steadily increasing since FY 2020, up 56% over four years. The continuing increase moderated in FY 2024 (+6.1%) compared to FY 2023 (+26.7%). The increase is being driven by BI claims (+7.6%) in comparison to FY 2023 and up 94% since FY 2020.


The higher-tier incurred groups continue to see an increase in the volume of claims, driving the increase in overall incurred value. The $100,000+ stratification increased in volume to 0.6% in FY 2024 from 0.5% in FY 2023. This small volume of claims now represents 34% of the overall incurred in FY 2024, representing a 6.21% increase from FY 2023.
Average paid increased by 5.9% for all new auto claims, driven by an increase in BI claims (+55.1%). When looking solely at loss paid, the average drops to a 5.4% increase for all claims but is still driven by BI claims, which increased 65.4% compared to FY 2023.

California (+87.4%), Florida (+80.3%), New York (+55.7%), Georgia (+48.2%) and Texas (+47.6%) all saw an increase in average paid for new AU BI claims.

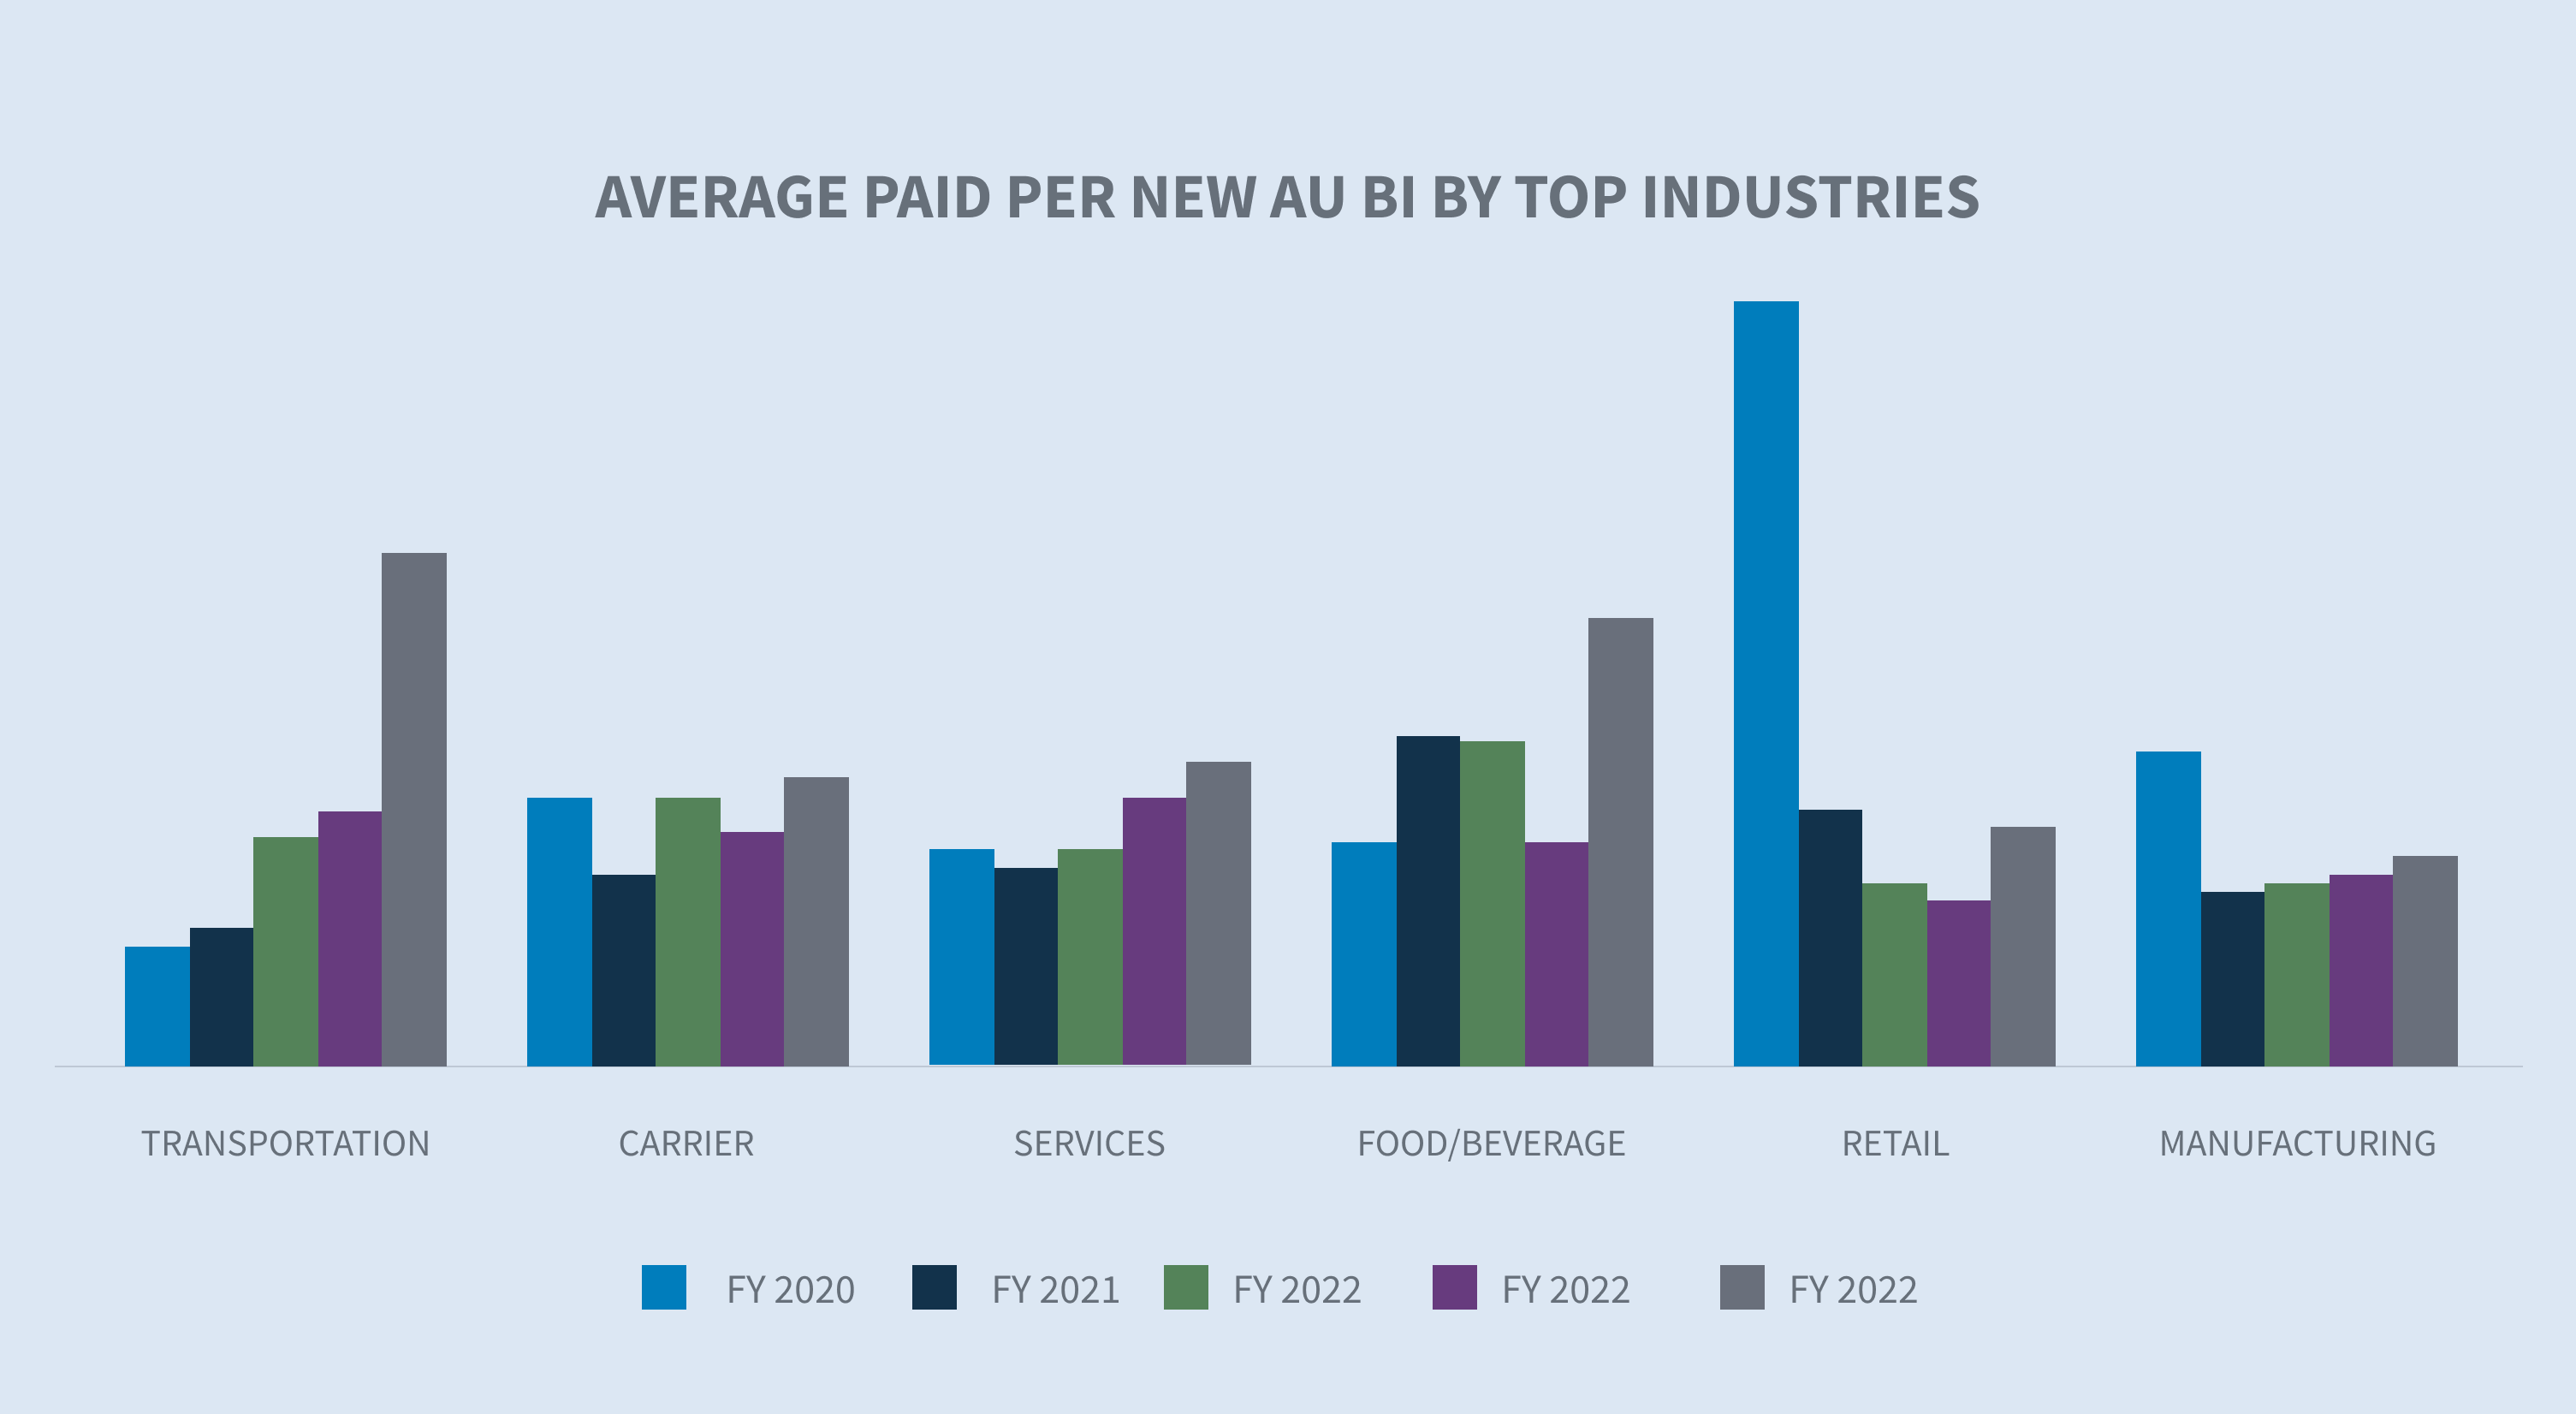
The average paid per new AU BI claim has increased across the top six industries, with two of them increasing by triple digits. The food and beverage (+104.5%) and transportation (+101.6%) industries saw the largest increases, followed by retail (+42.8%), carrier (+24.4%), services (+14.2%) and manufacturing (+10.9%).
Litigation
The overall litigation rate for new AU claims decreased to 0.62% in FY 2024 after an aggressive plaintiffs’ bar resulted in a 0.72% litigation rate in FY 2023. Fifty-nine percent of the claims that become litigated have representation in place within 24 hours of first notice, and 70% of all claims that become litigated have representation in place within 14 days.

The litigation rate decreased in all the top states except for New York. Florida saw a 64% decrease in its litigation rate in FY 2024 compared to FY 2023, though the FY 2024 litigation rate of 0.87% still exceeds the average litigation rate over the last four years. The New York litigation rate jumped back above 2% (+2.7%) after dropping in FY 2023.
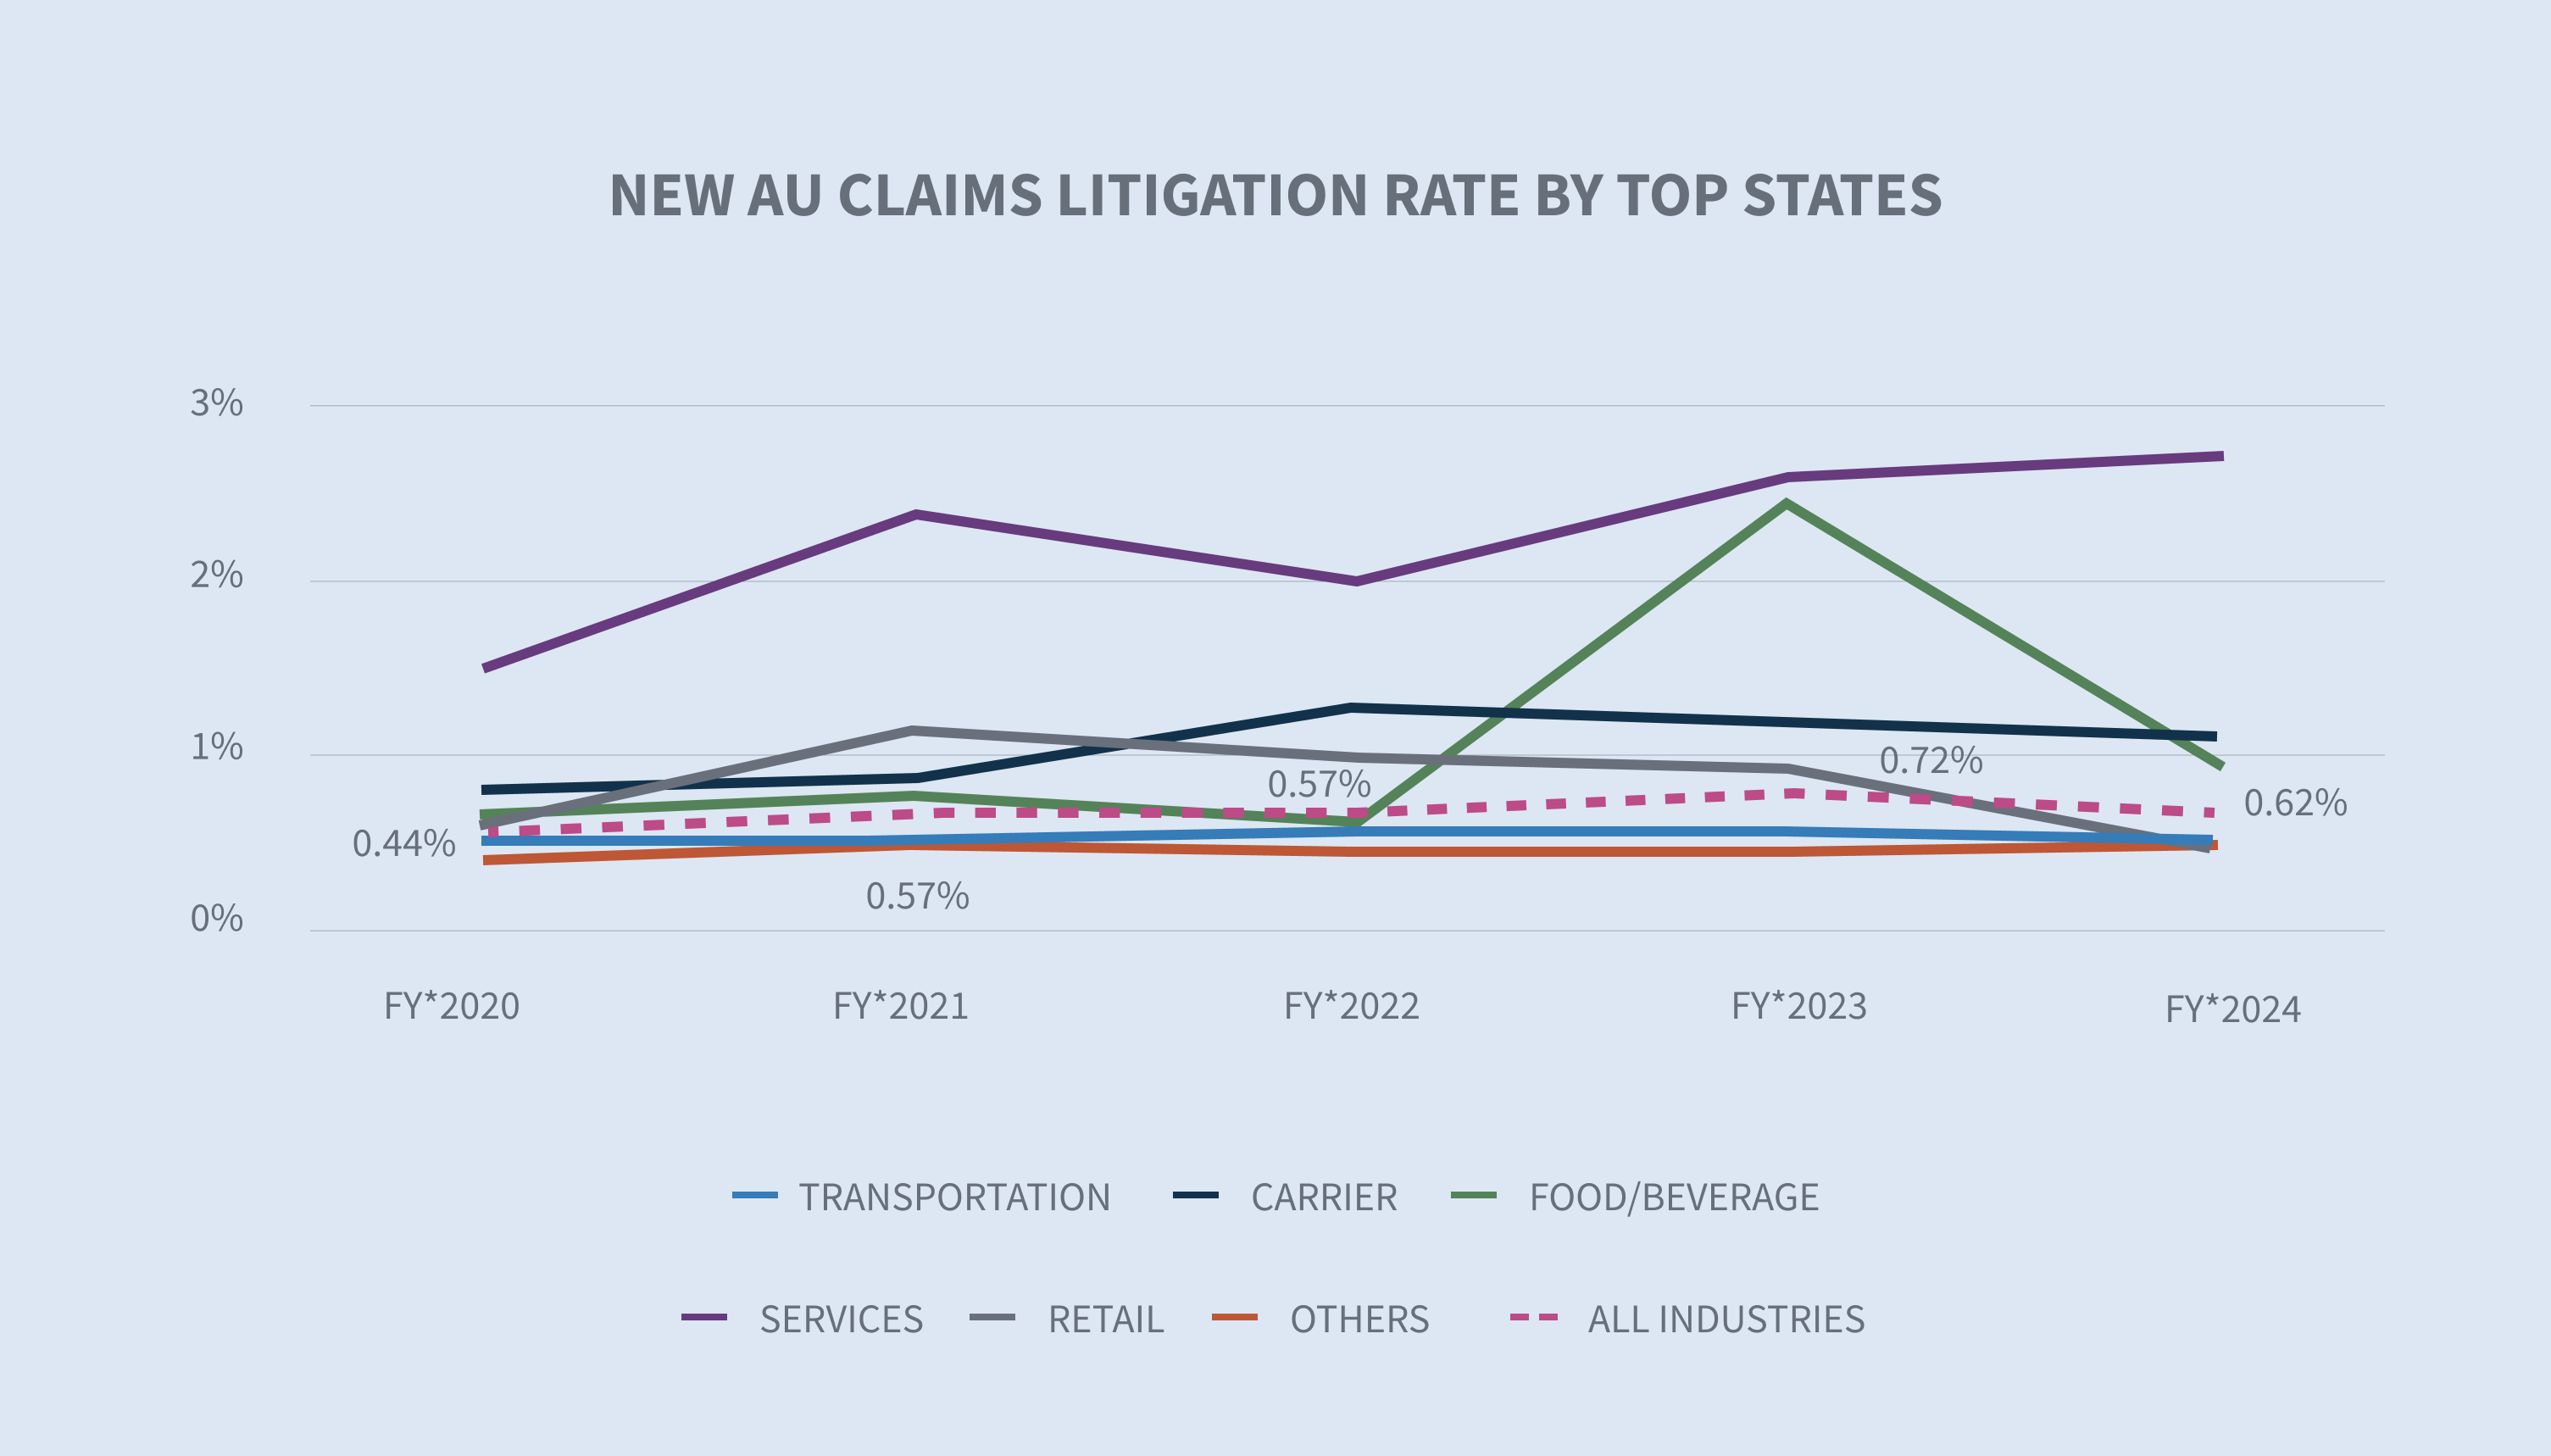
The top industries remained flat or saw a decrease in their litigation rate except for manufacturing, which increased to 0.58% in FY 2024 from 0.44% in FY 2023.

While litigation rates have decreased, the cost of litigated claims has continued to rise. Average incurred on new AU BI litigated claims increased 25% in FY 2024 compared to FY 2023. Average incurred values on new AU BI litigated claims are 5.6 times that of non-litigated claims.
Closed litigated AU claims average paid increased 23.2% since FY 2023 and nearly 57% overall in the last four years. The relative average cost of a closed litigated AU claim in FY 2024 is 28 times that of a closed non-litigated AU claim. The gap between litigated and non-litigated average cost of a closed claim is widening year over year from 24.7 times in FY 2022 to 25.6 times in FY 2023 and now 28 times in FY 2024. Additionally, though closed litigated AU claims only represent 3.98% of all closed claims, they account for 53.7% of all closed paid amounts.

Closings
Overall closures remained relatively flat for closed new AU claims. The percentage of new AU BI claims that closed increased 3.4 points in FY 2024.

Overall aged pending decreased by 2.1% to 11.9% in FY 2024. Non-litigated aged pending saw a decrease of 37% while litigated aged pending decreased only 1.75% in FY 2024. However, litigated claims now account for 67.6% of aged pending.

New York (-7.63%) and New Jersey (-7.52%) saw the most significant decreases in aged pending in FY 2024. However, New York still has the highest percentage of two-plus year aged pending at 33.7%.

Closed AU claim stratifications by volume and incurred amounts reveal that the top tier of $100,000+ has 2.1% of the volume but represents 69.3% of the closed incurred. This segment has risen 15.2% since FY 2023. As noted for average incurred on new AU claims, the top claim tier of over $100,000 is driving the increase in average paid at close.
Future considerations
Sedgwick trends
Consistent with the overall industry, Sedgwick auto claims data reflects:
| • | Continued increases in both incurred and average paid for new AU claims, although at a moderated rate compared to FY 2023. |
| • | New AU BI average paid increased 55.1% in FY 2024, driven by increases of 65.4% in loss paid and 17.7% in expense paid. |
| • | Closed litigated AU average paid increased 23.2% in FY 2024 and is up 51.3% since FY 2022. |
| • | Closed litigated AU claims represent only 3.98% of all closed claims but account for 53.7% of all paid closed claims. |
| • | The relative average cost of a closed litigated AU claim remains 28 times that of the average cost of a closed non-litigated AU claim. |
| • | For the upper-tier incurred groups of $100,000 and above: |
| ○ The percentage of overall claims increased in FY 2024. | |
| ○ The percentage of claims increased by 7.6% in FY 2024. | |
| ○ The average incurred is driving the overall increased incurred and average paid. | |
| • | Similar to the results in our last state of the line, increased claim payment costs continue to be exacerbated by external factors such as: |
| ○ Inflation | |
| ○ Rising medical costs | |
| ○ Rising repair costs | |
| ○ Complexity of repair costs (technology) | |
| • | Increased litigation payouts driven by closed litigated claims. |
| • | While the litigation rate dropped slightly in FY 2024, attorneys are becoming involved in more claims earlier in the claims life cycle. |
| • | Aged pending (claims open over two years) experienced decreases in both litigated (-2%) and non-litigated (-37%) categories. |
INDUSTRY CONCERNS
The industry has several recurring concerns and one new unknown that could significantly impact stability and profitability. The recurring concerns include driving behaviors, inflationary increases in medical care and vehicle repair, continuing increases in the cost of litigation, litigation financing and tort reform. The recent landmark decision of the United States Supreme Court in Loper Bright Enterprises, et al. v. Gina Raimondo, Secretary of Commerce, et al. creates some uncertainty in ancillary areas and will need to be closely monitored.
Driving behavior
The Federal Highway Administration reports that driving activity continues to increase on all roads and streets, up 1.3% over the past 12 months as of May 2024, with more of those miles occurring on urban highways. The Travelers Companies 2024 Risk Index on distracted driving underscores concerns that are making roadways less safe. The report lists some common distractions that are on the rise such as:
| • | Updating or checking social media |
| • | Typing a text or email |
| • | Talking on a cellphone |
| • | Using a cellphone to record videos or take photos |
| • | Reading a text or email |

The report further identifies business concerns with employees’ use of mobile technology while driving, and 68% of executives surveyed said they have implemented distracted driving policies.
Increased claim costs
According to the Bureau of Labor Statistics, the cost of medical care has increased in consecutive months since August 2023, rising at a rate of 2.2% through March 2024. However, some healthcare prices are increasing at a faster rate, including hospital services (+7.7%) when compared to the cost of all goods and services (+3.5%).
In their “2024 Q2 Crash Course Report,” CCC made several observations of trends identified in 2024:
| • | Total loss frequency is up 1.6% year over year due to continued erosion of used vehicle values and an increasingly aged vehicle pool where 73% of valuations are for vehicles seven years or older. |
| • | An increase in total loss frequency should relieve pressure on shop capacity and lower overall cycle times. |
| • | Total cost of vehicle repair increased at 3.3%, relative to Q1 2023. |
According to the U.S. Bureau of Labor Statistics, vehicle maintenance and repair costs have risen 23% since 2022.
The current inflation rate dropped below 3% in June 2024 for the first time in 12 months at 2.97%. The long-term average inflation rate is 3.28%, but the Federal Reserve targets 2% inflation as a healthy rate for the U.S. economy.

Increases in the cost of litigation
The cost of AU continued to increase in FY 2024. Three primary areas of concern continue to impact the industry:
1. Social inflation continues to drive the cost of litigation. A recent report from RAND Corporation noted the following (although RAND admits the results are not necessarily conclusive).
| • | Social inflation does not affect organizational defendants to a greater degree than non-organizational defendants. |
| • | Social inflation is not occurring equally in all states. The largest increases occurred in New York, California, New Jersey and Texas. |
2. Plaintiff attorney tactics continue to evolve. Tactics include jury anchoring, reptile theory and novel theories such as expansion of vicarious liability.
| • | Jury anchoring: A strategy used to cause jurors to use a specific, often random, point of reference when evaluating damages in a lawsuit. Typically, it includes making references to corporate revenue or income as a starting point for damages. |
| • | Reptile theory: This strategy continues to inflame jury awards nearly 15 years after its emergence and requires additional defense planning and preparation, driving up litigation costs and claim payouts. |
| • | Novel theories of liability for auto claims include expansion of vicarious liability: These novel theories require additional legal strategies to overcome. |

3. Nuclear verdicts are still on the rise, according to a May 2024 study by the U.S. Chamber of Commerce Institute for Legal Reform.
| • | The median nuclear verdict overall was $89 million. |
| • | Product liability, auto accidents and medical liability cases continue to comprise two-thirds of reported nuclear verdicts. |
| • | State courts represented over 90% of all nuclear verdicts when compared to federal jurisdictions. |
| • | Nuclear fallout settlements, defined as an increase in perceived settlement value based on previous nuclear and thermonuclear verdicts, are contributing to the increase in average paid and average incurred. Using pooled judgment committees is important for establishing case value with more objectivity. |
Loper Bright Enterprises v. Raimondo, Department of Commerce, et al., one of the recent landmark cases impacting the Chevron deference, will most certainly impact risk management circles. While it is much too early to truly understand the full impact of the removal of this deference to administrative agencies in interpreting new laws, we can expect more litigation in certain arenas. Administrative agencies, which are established by the executive branch, are empowered to create guidelines, rules, processes and procedures to execute new laws, particularly where the statute is ambiguous. The Loper Bright decision will not change this responsibility. What it will change, however, is who the final arbiter of whether or not the guidelines, rules, processes and procedures created by those agencies are reasonable interpretations of the statutes. The agencies in question include the National Highway Traffic Safety Administration, the Economic Development Administration, the Consumer Product Safety Commission and the Centers for Medicare and Medicaid Services (CMS). These agencies establish rules and guide ambiguities within the statutes that have an impact on the way many of our clients conduct business.
Consider Medicare set-aside agreements, which are often required in liability cases. CMS has developed guides to calculate Medicare set-aside amounts, as well as many other aspects of the process. Medicare set-aside agreements often include projected costs for prescription drugs from CMS that are based on unrealistic drug prices developed by drug manufacturers, also known as average wholesale prices (AWP).
The recent Loper Bright decision opens the door to challenge the use of AWP by removing the deference to the administrative agency that developed the guidelines. This is just one example in what will surely be a long line of challenges to administrative authority and one that Sedgwick is watching closely.
Litigation financing continues to be debated at both the state and federal levels. While there is movement in attempts to change the litigation financing industry, only Indiana, West Virginia, Wisconsin, Montana and Louisiana have passed legislation requiring transparency. There is proposed legislation in both the House and the Senate at the federal level, with the House Judiciary Committee having held a hearing on June 12, 2024, to debate third-party litigation funding. Following that hearing, Rep. Darrell Issa (R-CA-48) released a discussion draft of proposed legislation for all federal cases that ensures transparency around all parties where a litigation funder has invested in a lawsuit and will receive a payment based on the outcome.
Litigation financing is also playing a role in other aspects of our civil justice system, such as personal and mass torts. As the litigation funding industry evolves, distinctions are arising between litigation financing and consumer legal funding, and there is some debate about whether this distinction changes the impact. Consumer legal funding assists plaintiffs with ongoing daily living expenses in anticipation of an award, and litigation financing funds the prosecution of the plaintiff’s case. Both, however, charge interest and fees on top of the original amounts involved in the funding. Litigation financing will continue to be an active area of concern and will likely have additional legislation passed at both the state and federal levels.
Tort reform, particularly in Florida, is benefiting the insurance landscape. Sedgwick’s data shows that the rate of new lawsuits decreased by 3% through week 26 in 2024 over the same period in 2022. The data also shows a 70% decrease from the same period in 2023, though the significant rush to file lawsuits in Florida in 2023 is a big driver in that decrease. With 2024 being an election year, tort reforms historically take a back seat in priorities due to shortened legislative sessions and the controversial nature of the issue. However, pending and proposed tort reforms (both expansive and restrictive) will be important to watch even in Florida as legislation is being pushed by the trial bar that would allow plaintiffs access to claim files of insurance companies. Other important tort reform issues across the country include premise liability reform, limits on non-economic damages in medical liability cases and third-party litigation funding.
Conclusions
Economic and social inflationary pressures are driving most of the increases in claim severities. There is no doubt that the volume and average severity increases in the top tier ($100,000+) are directly related to these pressures. When coupled with increases in litigation and the average cost of litigated claims being between 28 and 30 times that of non-litigated claims, organizations must adapt and be responsive to these shifts. More timely and focused claim investigations will set the stage for better outcomes. The earlier that claims organizations can obtain evidence needed to assess liability and injury valuation, the more impactful that knowledge can be in seeking appropriate resolutions. Pooled judgment structures such as high-severity review committees will bring the additional perspectives needed to navigate claims in the highest tiers. Claims organizations should also consider beginning work earlier that’s usually completed post-suit, such as biomechanical engineers, accident reconstruction and jury focus groups. Mock trials are becoming less valuable and more expensive than jury focus groups, which allow for a town hall forum of questions and answers. However, mock trials still have a place in a defense strategy.
Corporations would also be well-served to identify corporate witnesses long before they are needed and train them on how to be a good corporate deponent. The defense industry needs to see our response to current conditions as a long-term strategy.
Sedgwick’s liability litigation observations and trends commentary published in May of 2024 provides more in-depth analysis on the prevailing trends and practices in the liability landscape, including a deeper dive into plaintiff bar tactics, social inflation and the use of analytics in litigation management.