
- Summer 2024: BENEFITS
Disability
Report objectives
This report aims to summarize the present metrics for our disability programs, assess the landscape of disability claim administration and litigation, and benchmark our patterns against comparable industry research.
data parameters
Our practice team uses JURIS claims data to perform comparative analyses informed by their expertise and analytics. The data in this report is based on the first half of each year, January through June, for each reporting year.
Key observations
Short-term disability (STD) incident rates continued to decrease from 10.7% in 2023 to 10.4% in the first half of 2024. New claim volumes are trending downward, as are open volumes. However, durations have increased on closed claims. Since COVID-19 claims are no longer a factor in most disability claims, incident rates have stabilized.
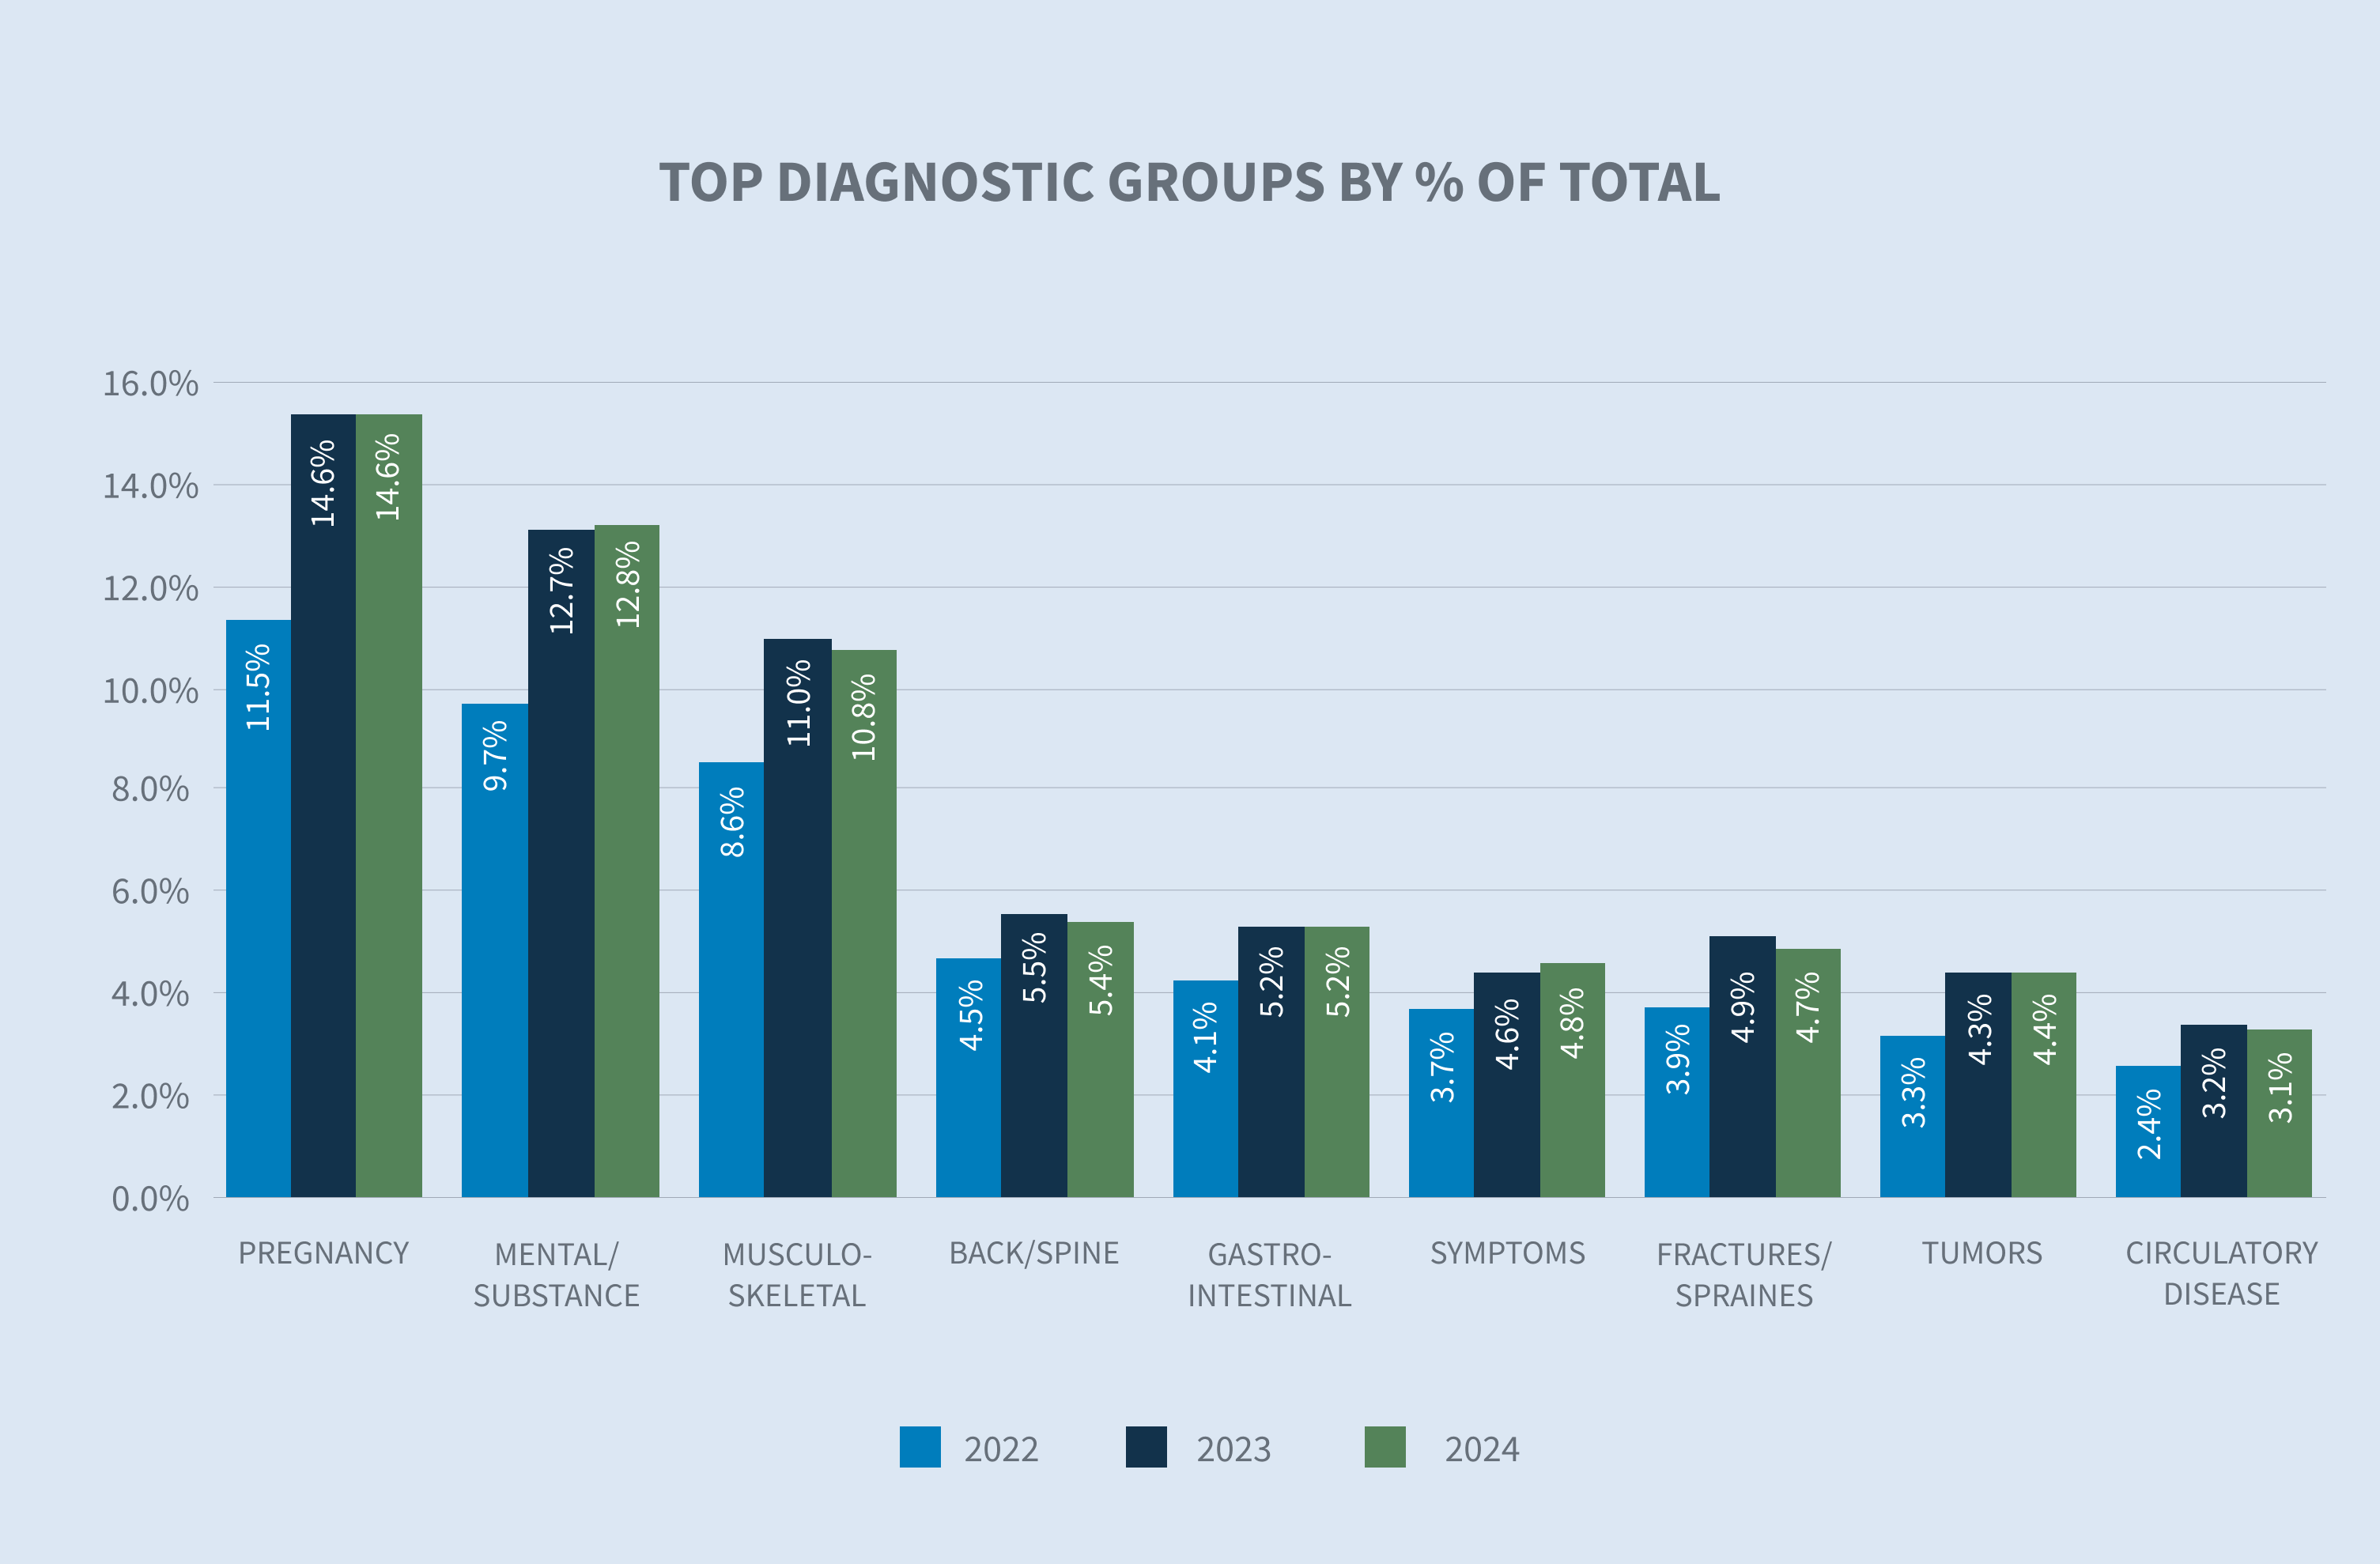
Pregnancy is the leading diagnostic group for new STD claims as of mid-year 2024, accounting for 15% of the claims. Mental health/substance abuse has remained steady compared to last year and constitutes 13% of the claims as of mid-year 2024.

While new volumes slightly decreased 0.3% in 2024, the average STD duration rose 3.2% compared to 2023. Mental and substance-related claims increased in duration from 68.4 days in 2023 to 72 days in 2024, contributing to this overall increase.
Initial denial rates for STD have stayed consistent over the past three years. There was a 1% decrease from 2022 through the end of 2023, but it appears that denial rates are stabilizing in the first half of 2024. Resolved claims and subsequent denials have increased 1%, but overall, they remain stable. The rate of “no medical received” for initial denials decreased 3.2% compared to 2023. Denials by plan increased 2% over the past three years, with a notable rise compared to 2023, which could align with how clients have been updating their plans recently.
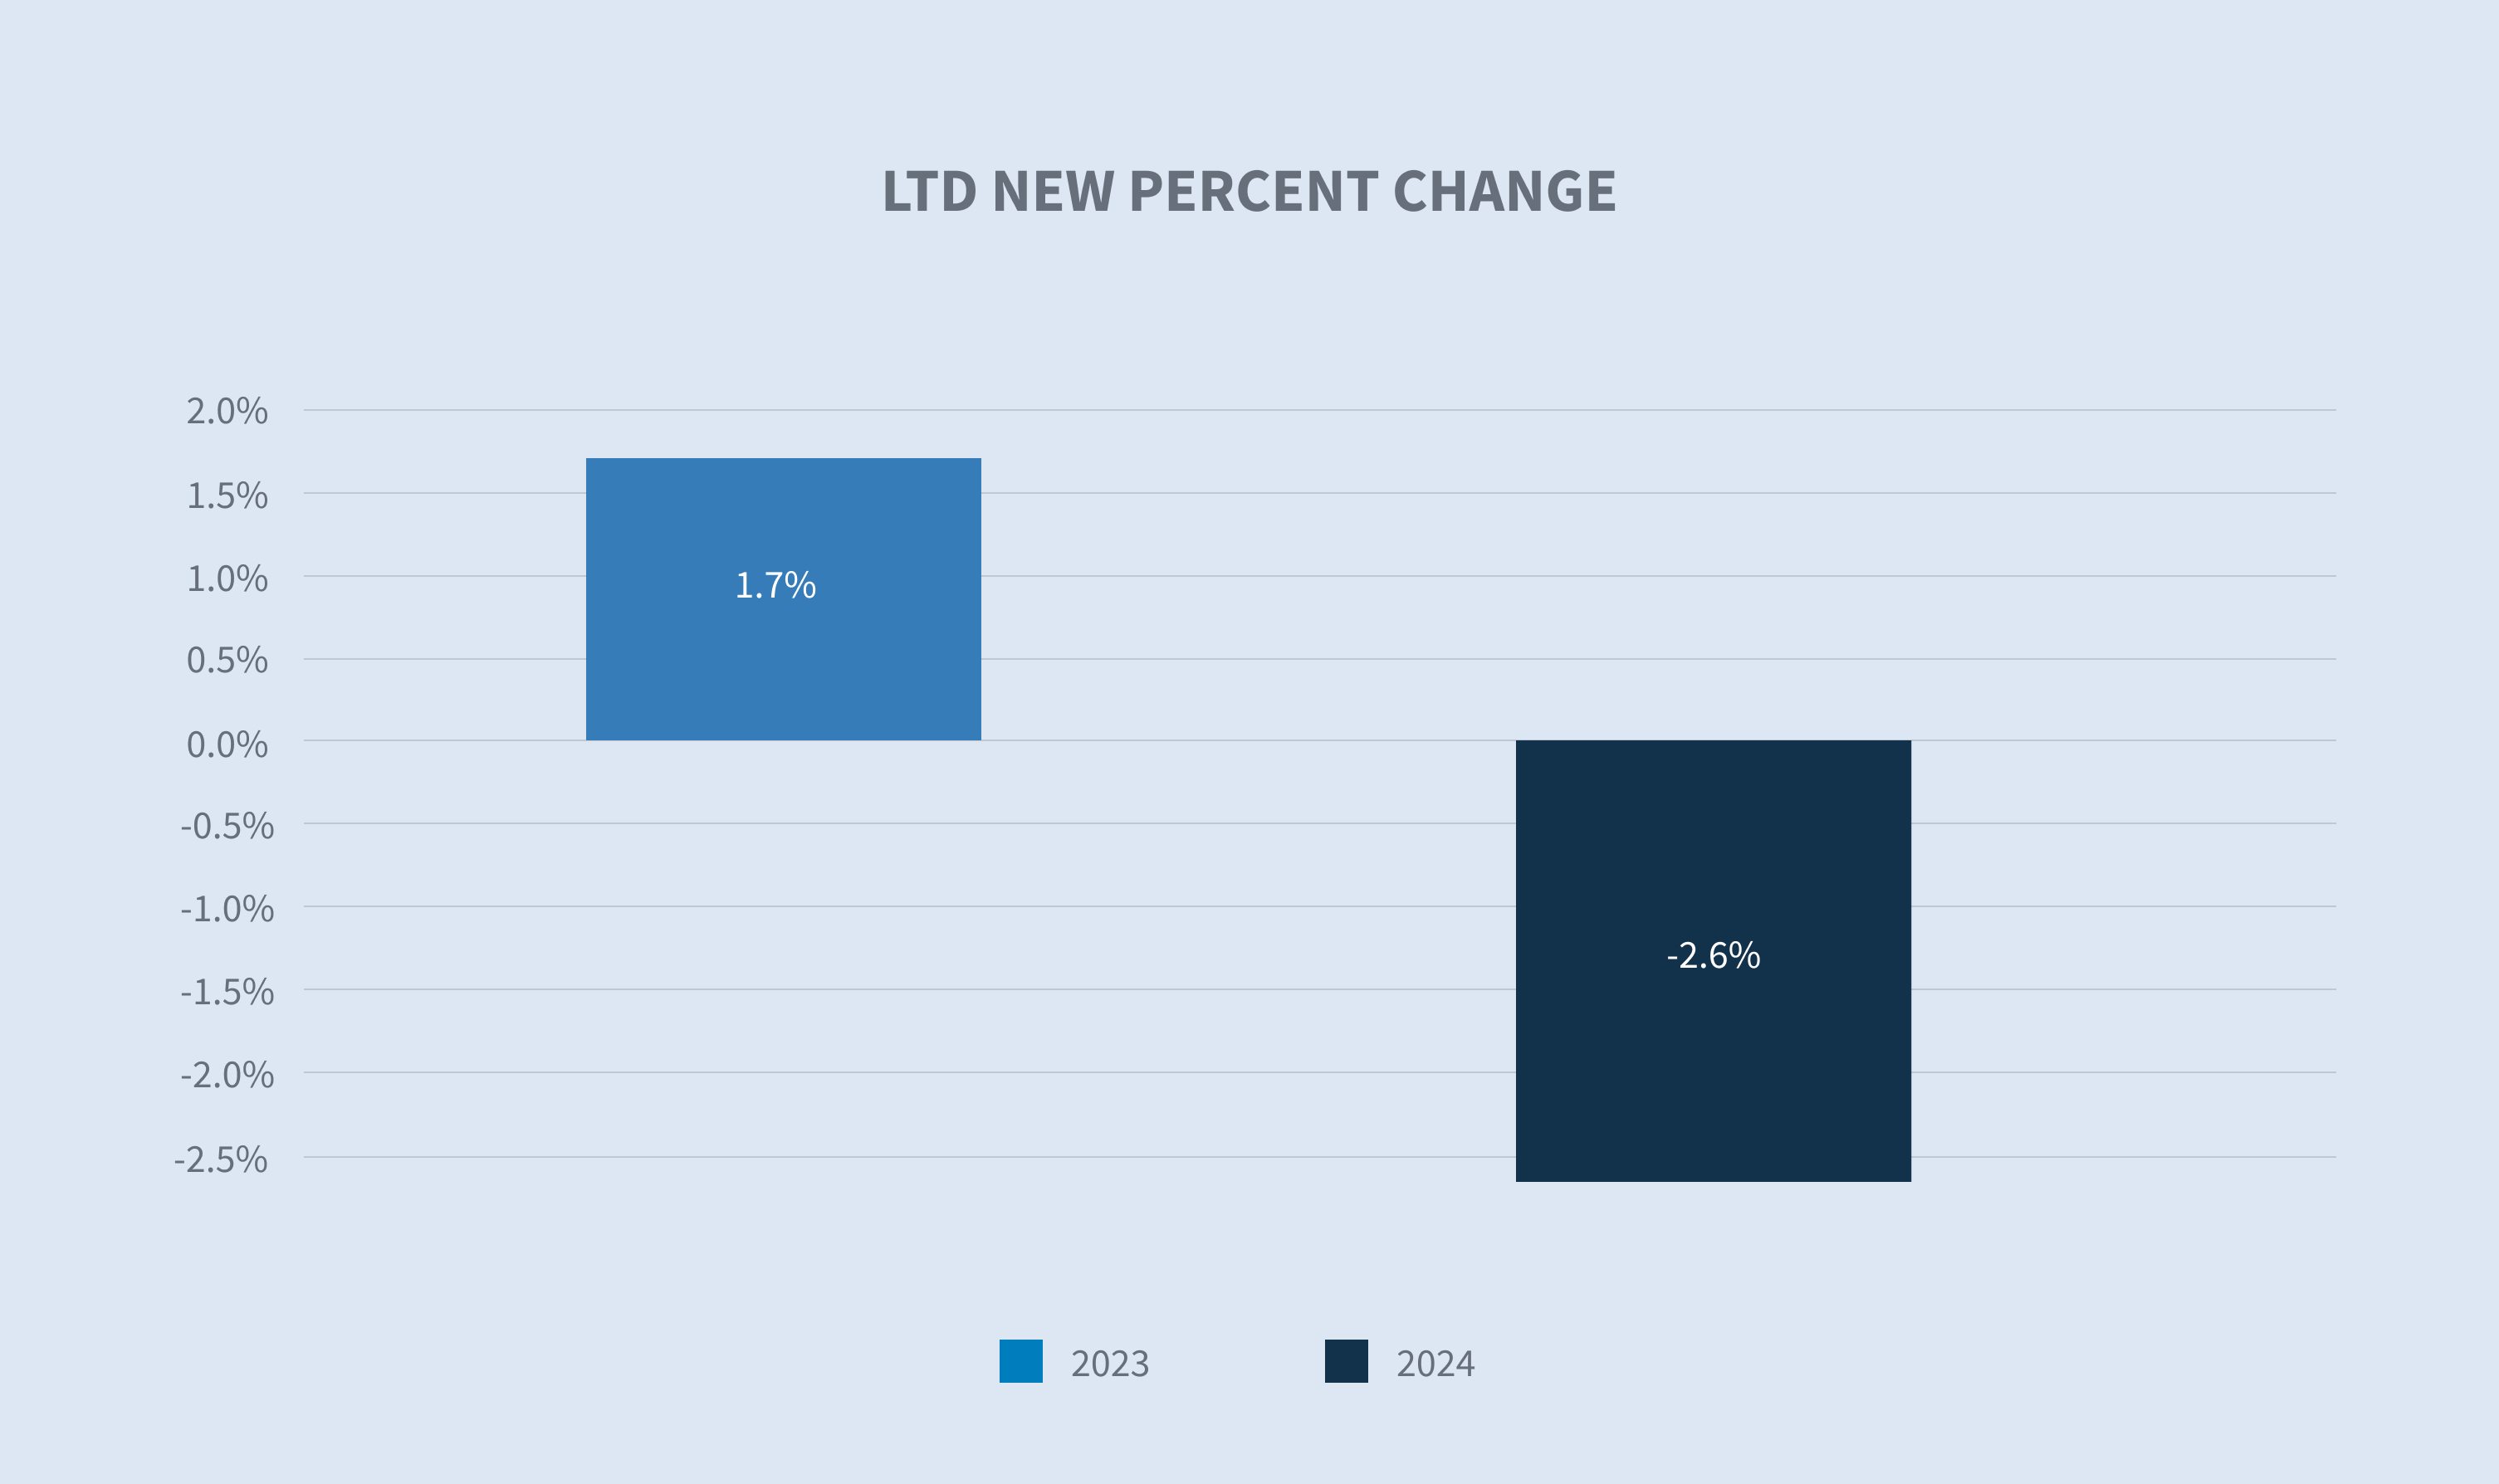
Long-term disability (LTD) claim volumes decreased slightly by 2.6% in 2024 compared to 2023 volumes.
Short-term disability
New claim volumes
Over the past year, new claim volumes decreased 0.3% compared to 2023. January 2022 saw a peak in COVID-related claims, which then dropped significantly and leveled off to a more consistent trend. Incident rates have also been trending downward. By industry, new claim volumes reflect this same pattern, with volumes decreasing and stabilizing from 2022 onward. The retail industry had the smallest (4.98%) decrease in volume compared to the previous year, while the services industry saw an upward trend of 3.11%.

Incident rates by year
Looking at a three-year trend from 2022, we see a significant drop in incident rates aligning with the spike in COVID-19 claims seen in early 2022. The downward trend in 2023 and 2024 mid-year incident rates are stable with a slight decrease, indicating that COVID-19 is no longer impacting incident rates as it did in 2021 and 2022.

The retail, trade and transportation industries saw a reduction in claim volumes and incident rates, although the claim durations increased. In contrast, the healthcare industry experienced a decrease in both new claim volumes and incident rates. However, all industries reported an increase in claim duration, with mental and substance-related claims continuing to rise in duration.

Diagnostic groups by percent of total
New claim volumes for diagnostic groups have remained steady, with increases in mental health claims.
Early in the pandemic, anxiety rates surged significantly due to widespread uncertainty about health and financial stability. From 2019 to 2020, the anxiety incident rate rose by 19.2% and remained high throughout 2021. In 2022, this rate began to decline, dropping by 12.3%. However, in 2023, there was a 3% increase, followed by a 0.1% rise by mid-2024. Anxiety and depression account for the majority of mental health claims, with anxiety continuing to increase by 1% in new volumes for 2024.
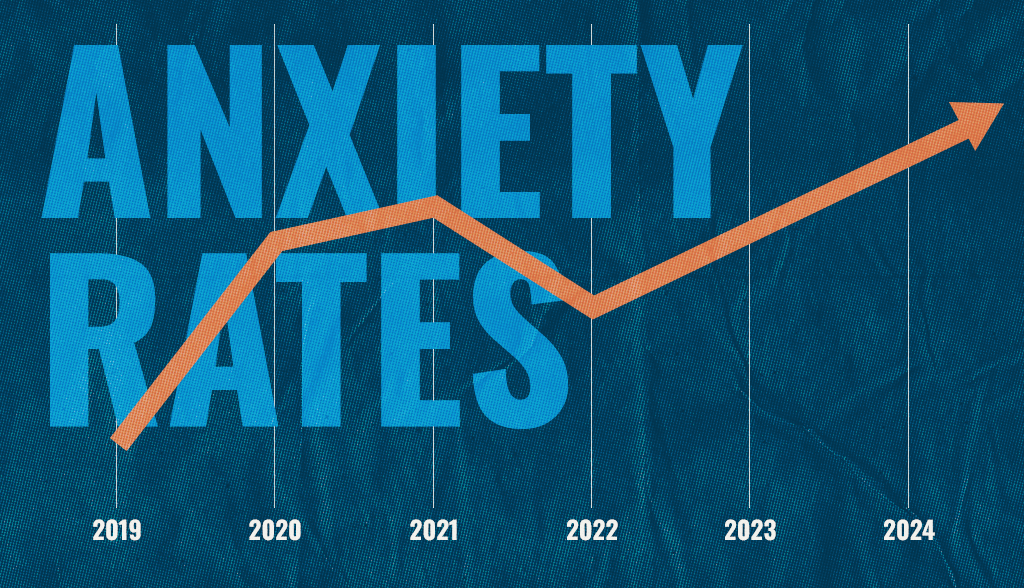
Looking ahead, it is anticipated that mental health claims will continue to rise. This trend aligns with a recent poll by the American Psychiatric Association (APA), which found that 43% of U.S. adults felt more anxious in 2024, versus 37% of adults who felt anxious in 2023. Outside of pregnancy, it is the top claim diagnostic code, and proposed rule changes to the Mental Health Parity Addiction and Equity Act (MHPAEA) could cause this to increase further when the final rules are published.
Average total approved days
Overall STD durations are up mid-year, showing an increase from 2023 to 2024 by 3.2%.

Mental/substance appear to be a driving factor, with an increase of 5.32% compared to the previous year. Anxiety and depression have both increased in duration compared to 2023.

New claims by age
The age distribution of new STD claims reported in 2024 remains stable compared to 2023. There are increases in claims for the 55 and older and 35 to 45 age groups compared to previous years.
In the current reporting year, mental and substance-related claims constitute the highest volumes for the 35 to 45 age group, followed closely by the 25 to 35 and under 25 age groups. Given that most media reporting deals with wider acceptance among the under 25 and 25 to 35 age groups, the increase in claims shows that stigma around mental health issues are decreasing for all age groups. For the 55 and older age group, musculoskeletal issues are the primary leading International Classification of Diseases (ICD) code for new claim volumes.


New claims by length of service (LOS)
The largest length of service group reporting claims is still the less than three years group, as that group has only increased slightly compared to the previous year but has continued to trend upward in the past three years. Given the market realignment that took place in 2021 and 2022, we expect the three to five length of service group to become the leading driver of claims in the next nine to 18 months.

Claim closure reasons
Initial denials have remained stable, with an increase observed from 2021 through 2022, but have been trending downward consistently over the past few years as COVID-19 claims have fallen off. However, the subsequent denial rate has increased, with ‘medical does not support’ denials rising from 31.7% in the prior year to 32.5% in the current reporting year.

The percentage of claims denied due to lack of medical documentation continues to decrease for both initial and subsequent denials. Initial denials due to no medical documentation dropped from 37.2% in 2023 to 34% in 2024. Given how access to care is becoming a larger issue, especially in mental health cases, we could continue to see increased denials for lack of medical for certain diagnostic categories in the next few years.

Of the claims resolved in 2024, 22% were due to exhaustion of benefits, marking a steady increase since 2021. Claims resolved due to employee death accounted for 0.6%, while 77.8% were resolved because the employee returned to work. This return-to-work rate is stable compared to the previous year, but still represents a decrease from 2022.

Average cost per claim
The average cost per claim has increased 8.6% year-to-date in 2024. This rise corresponds with the ongoing increase in claim durations. Additionally, the higher payments are influenced by the wage increases seen in 2023. According to the U.S. Bureau of Labor Statistics (BLS), for the 12-month period that ended in September 2023, wages and salaries increased by 4.5%. Additionally, employers are exploring plan design changes, with more companies offering increased disability benefit payments.

Incident rates by diagnostic group
Mental and substance-related volumes remain among the top five diagnostic groups across all industries. They are the leading cause of disability for new claims reported in the financial, insurance and real estate sectors. Similarly, the services and transportation, communications, power and sanitary services sectors also report mental and substance-related issues as the leading diagnostic group for new claims this year.
Incident rates for mental and substance-related claims by industry show similar trends. The financial industry group saw an increase to 2.0% in 2024 from 1.9% in 2023. The services group also experienced an increase, rising to 1.9% in 2024 from 1.6% in 2023. Other industries show either small increases or decreases in incident rates.

Long-term disability
New claim volumes
Long-term disability claim volumes decreased 2.3% from 2023 to 2024. LTD rates remain steady, with volumes mostly impacted by clients joining or leaving Sedgwick.
Average paid on closed LTD claims
The average paid on closed LTD claims increased 1% in 2024 compared to 2023. This average can fluctuate as longer or shorter duration claims are closed but generally stays within the same range.
Like the increased cost on STD claims, much can be attributed to the nationwide increase in salaries and wages along with increased durations.
Future considerations
Mental health provider shortage
According to the Psychiatric Times, the supply of mental health providers has been decreasing. An estimated deficit of 7,500 psychiatrists is projected for 2025. The Association of American Medical Colleges (AAMC) reports this number could be as high as 31,000 and 150 million Americans live in areas short on mental health professionals. If employees struggle to find appropriate care or have long wait times to see a provider, this could lead to changes in approval/denial rates or an increase in mental health claim durations.

A consideration for employers is to review their STD plan, specifically any provisions for treatment with a mental health professional. A study by Bank of America showed that by expanding the definition of an appropriate provider to include clinical psychologists and psychiatric nurse practitioners, the mental health denial rate decreased from 10.9% to 3.7%.
A proposed rule under the MHPAEA could cause further disruption to access to care as it would require LTD carriers to remove any maximum benefit durations built into current LTD plans. This would put additional pressure on employers to more actively manage STD mental healthcare claims, which is already strained due to lack of providers.
Long-haul COVID-19
Research suggests that between one month and one year after having COVID-19, one in five people ages 18 to 64 has at least one medical condition that might be due to COVID-19. Among people aged 65 and older, one in four has at least one medical condition that might be due to COVID-19. The Centers for Disease Control and Prevention (CDC) recently published that overall, one in 13 adults in the U.S. has long COVID symptoms.

The most commonly reported symptoms of long-haul COVID-19 include:
| • | Fatigue |
| • | Symptoms that worsen after physical or mental effort |
| • | Fever |
| • | Lung (respiratory) symptoms, including difficulty breathing or shortness of breath and cough |
Long-haul COVID-19 is increasingly becoming a cause of disability and accommodation requests.
Sedgwick began tracking when physicians certify a claim as long COVID in October 2022. Approximately 0.9 claimants per 100 employees have reported a long COVID STD claim; however, we are only capturing long COVID when it reaches severity requiring absence from work and a physician identifies the claim as long COVID on the medical paperwork.
There is not a significant difference in long COVID claims filed by age, with employees 35 to 44, 45 to 54 and 55 and older all reporting claims at approximately the same rate.

Loper Bright Enterprises v. Raimondo
This recent U.S. Supreme Court case overturned a 40-year precedent set in Chevron v. Natural Defense Resource Council. The initial decision in Chevron held that the courts should defer to the appropriate regulatory agencies when the federal legislation is ambiguous or has a gap. Considering Loper, this means that courts no longer must defer to agency interpretation of grey areas. The greatest impact could be felt by agency rulings from the U.S. Department of Labor (DOL) and Equal Employment Opportunity Commission (EEOC) as it relates to the Family Medical Leave Act (FMLA) and Americans with Disabilities Act (ADA) and most recently the Pregnant Workers Fairness Act (PWFA). Further impacts could be felt at the state level if challenges are made to the regulatory interpretation of statutory Paid Family and Medical Leave (PFML) benefit programs at the state level.

Expansion of paid leave policies
Paid leave provides financial support (and sometimes job protection) when a new child or a personal or family care need requires an employee to take time away from work. Partially due to the after-effects of COVID-19, employers and politicians better understand how necessary it is to provide paid leave to workers in support of them and their families. Although there is currently a task force in Congress working on a bipartisan federal solution, it is not likely that a federal paid leave option will be passed based on Congress’ current makeup. Therefore, states continue to establish and expand paid leave programs.
Here is a list of recent implementations and expansions:
Washington Paid Family and Medical Leave (WA PFML): Effective Jan. 1, 2025, any interested party will have access to certain records and information related to an employee’s paid family or medical leave claim, including the type of leave being taken, the duration of the leave, and whether the employee was approved for and paid benefits. This Washington amendment defines “interested party” as a current employer, a current employer’s third-party administrator or an employee.
California Paid Family Leave (PFL) and California State Disability Insurance (SDI): For PFL and SDI claims beginning on or after Jan. 1, 2025, individuals who earn 70% or less of the state average quarterly wage (SAWW) will receive a benefit of up to 90% of the average weekly wage (AWW). Individuals who earn more than 70% of the state average quarterly wage will receive a benefit of up to 63% of AWW.
Maryland enacted a Family and Medical Leave Insurance program (FAMLI) on April 9, 2022, effective July 1, 2026.
Delaware enacted the Healthy Delaware Families Act on May 10, 2022, effective Jan. 1, 2026.
Minnesota enacted a Paid Family and Medical Leave Act on May 25, 2023, effective Jan. 1, 2026.
Maine enacted a Paid Family and Medical Leave Act on July 11, 2023, effective May 1, 2026.
Recent state programs have implemented a two-part (and sometimes three-part) formula, providing a higher percentage of wage replacement to lower-wage workers. This was done in hopes of supporting people who are more financially insecure. This trend started with Washington providing low-wage earners 90% of their earnings. Minnesota and Maryland will do the same when their benefits take effect in 2026.
States with multi-part formula and the percentage of wage replacement that they offer lower-wage earners:

Generally, the definition of family member has trended to be more inclusive. Recently enacted laws extend the definition of family member beyond parents, spouses and children to include grandparents, grandchildren, siblings, parents-in-law and domestic partners. More importantly and more generously, in six states, family also includes a person “to whom the worker is related to by blood or affinity.” The “blood or affinity” family member definitions are applicable in Washington PFML, New Jersey FLI, Connecticut FMLA and Paid Leave, California Family Rights Act (CFRA), Paid Leave Oregon and Colorado FAMLI. Interestingly, both Maryland and Delaware have both chosen not to follow the trend of implementing this expanded family member definition. Minnesota and Maine continue with the “blood or affinity” relationship as part of their PFML programs.
Upcoming implementations and likely new states
Multiple state-paid leave programs rolled out in 2023 and 2024. Oregon Paid Leave benefits began Sept. 3, 2023, and Colorado FAMLI benefits began Jan. 1, 2024. After that, we have our first 2026 implementations: Delaware and Minnesota will both roll out on Jan. 1, 2026. Maine is slightly behind this first grouping, implementing on May 1, 2026, and Maryland will go live July 1, 2026. That means there will be four new paid family and medical leave programs going live in 2026.

These states will not be the last. Based on the current makeup of the legislatures and governorships, it is likely programs will pass in Vermont, Michigan and New Mexico. Many other states continue to propose legislation and will likely try again as they have for the past few years.